Auditing PK-79: A Mathematical Approach
Osama Khalid
12-03-2024
Introduction:
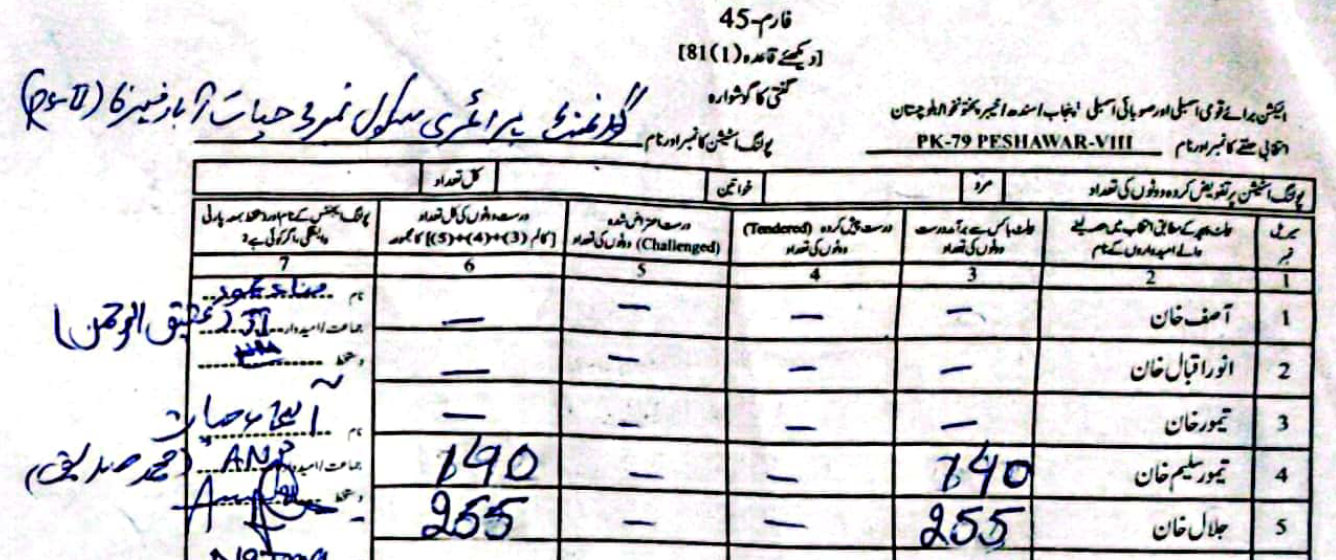
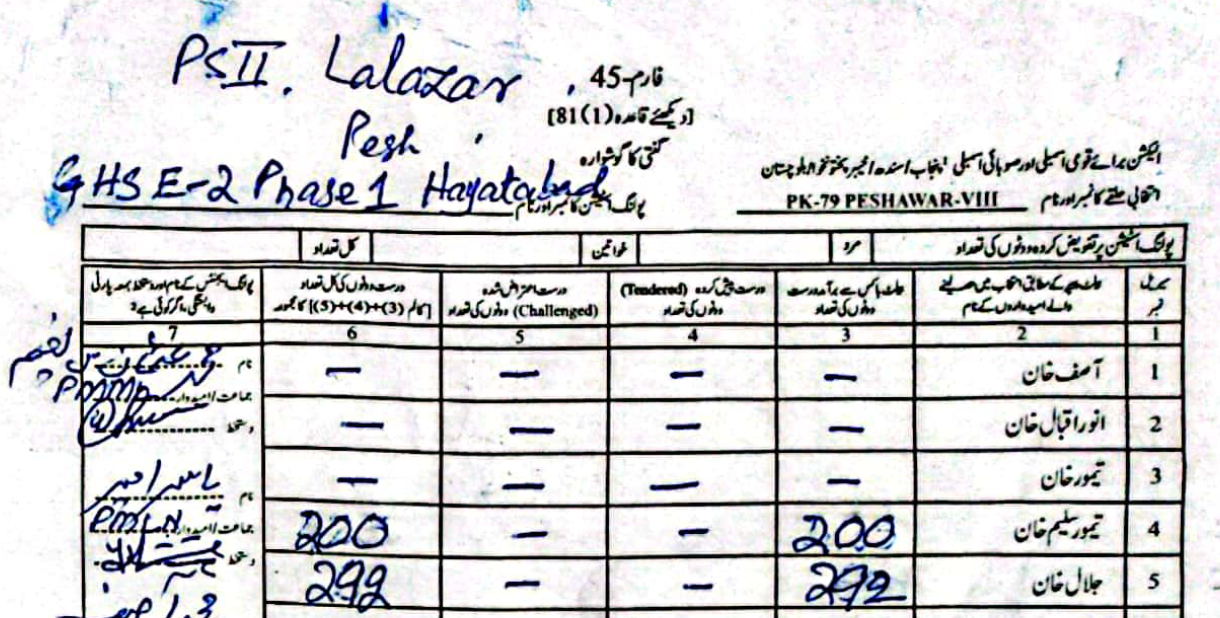
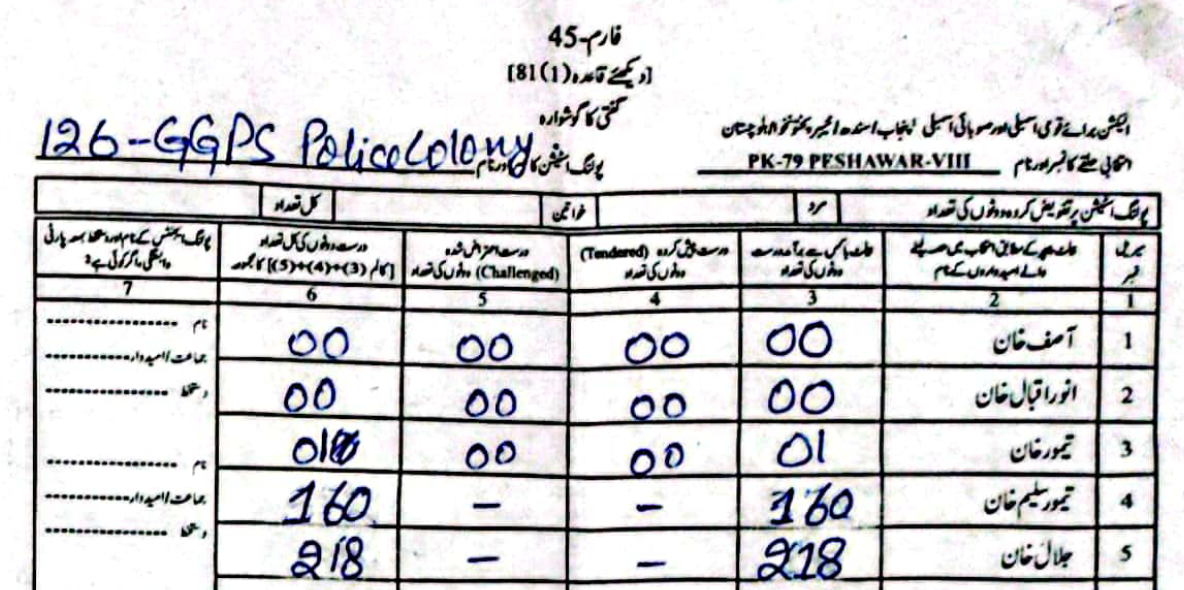
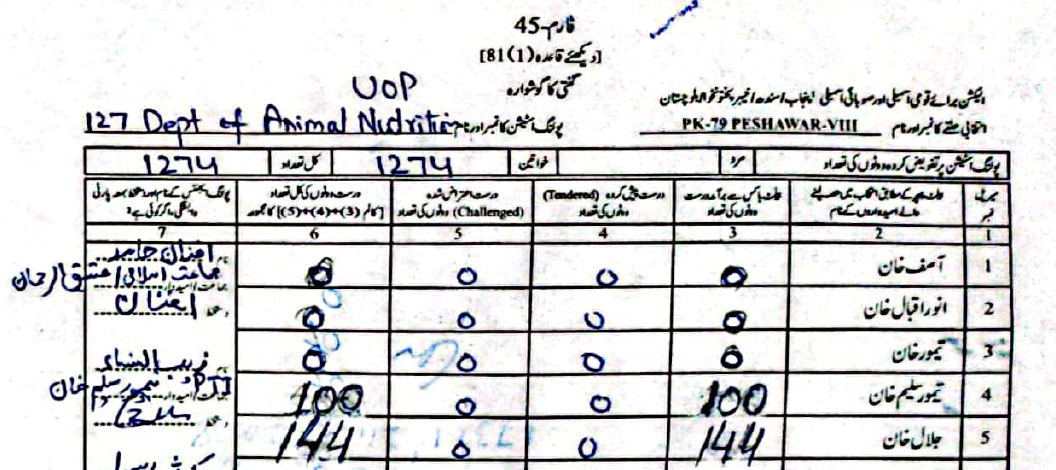
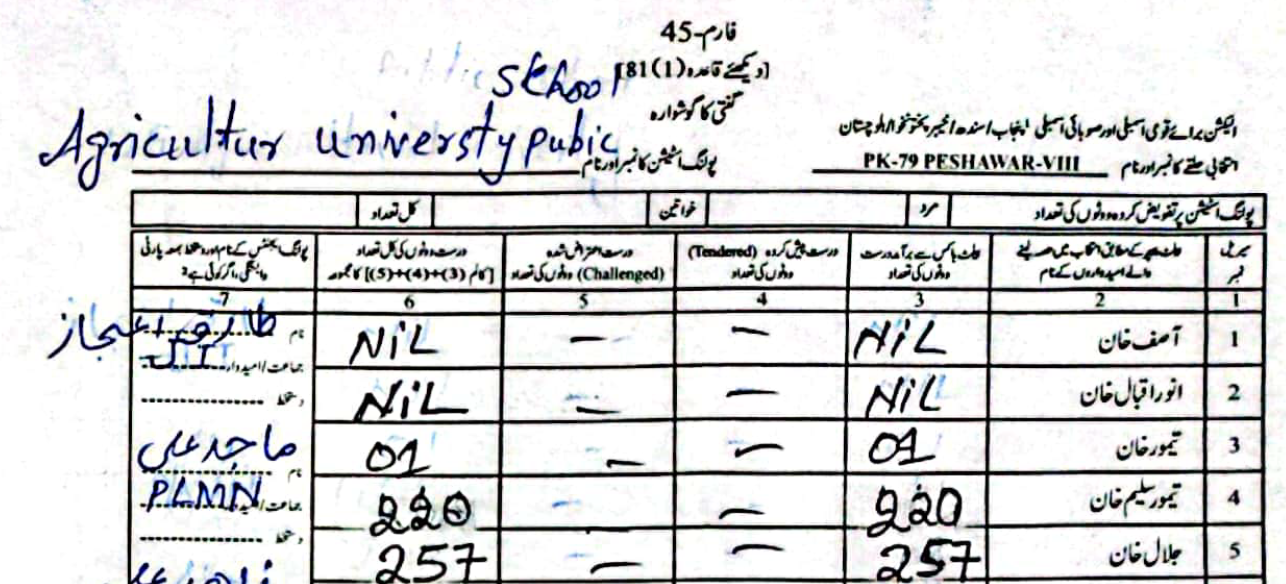
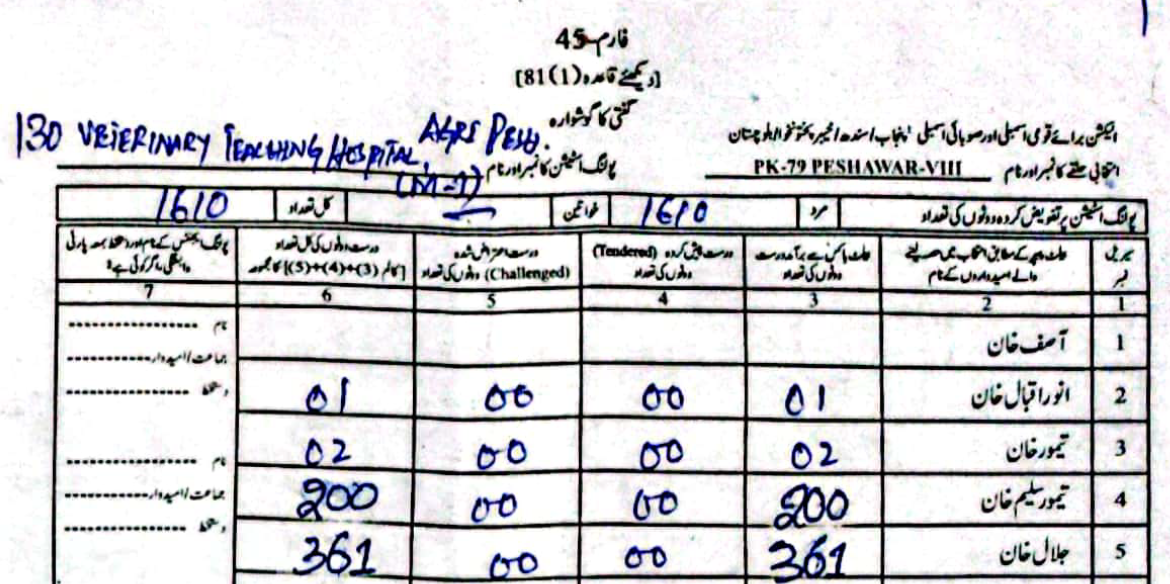
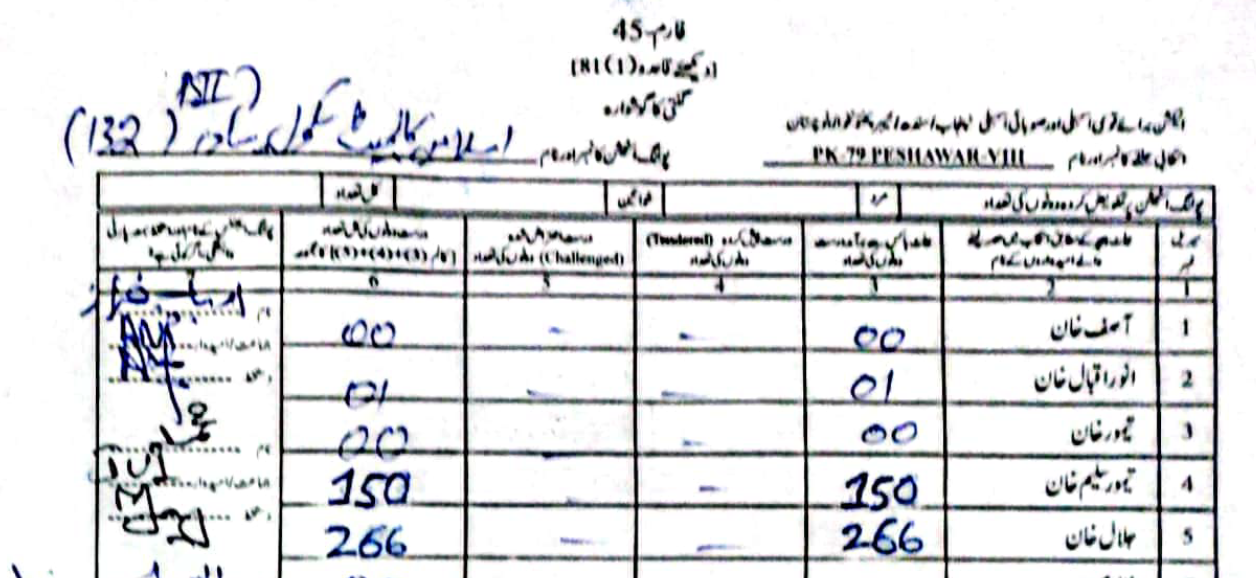
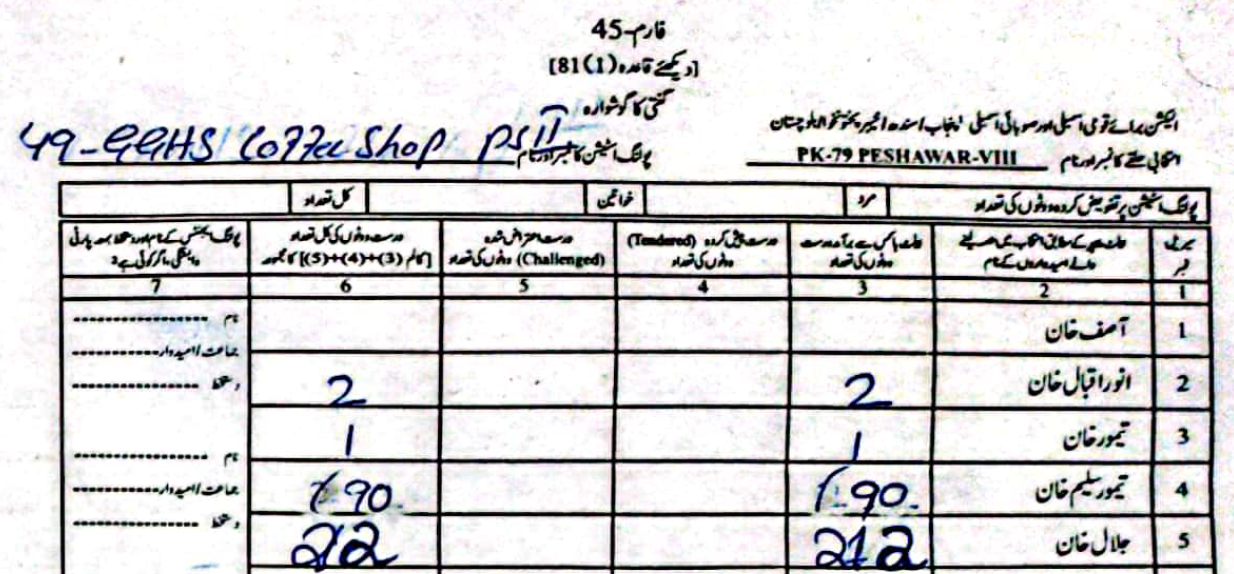
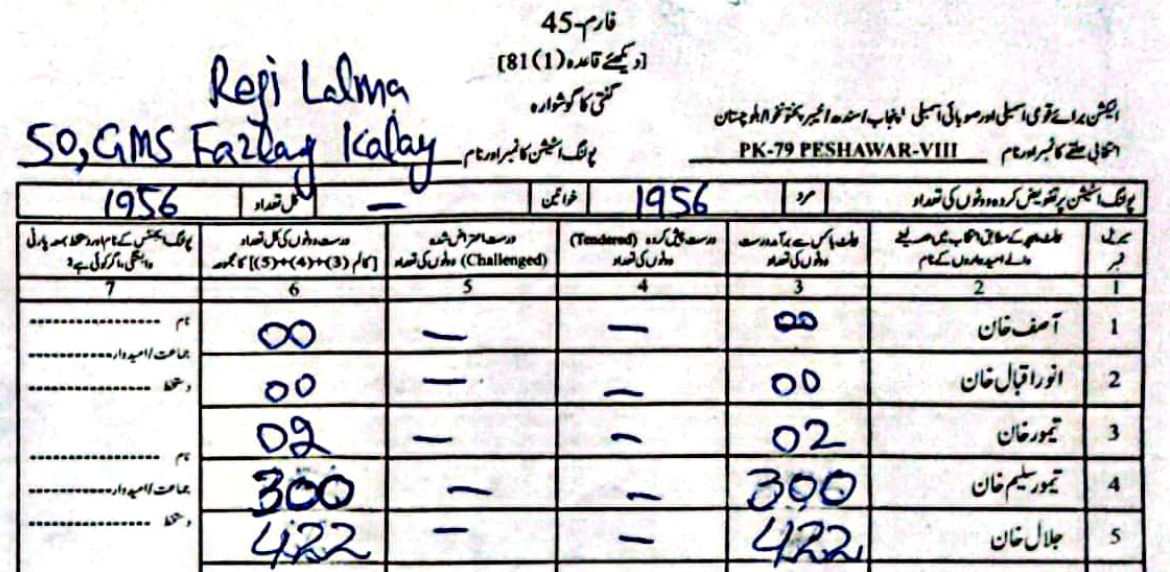
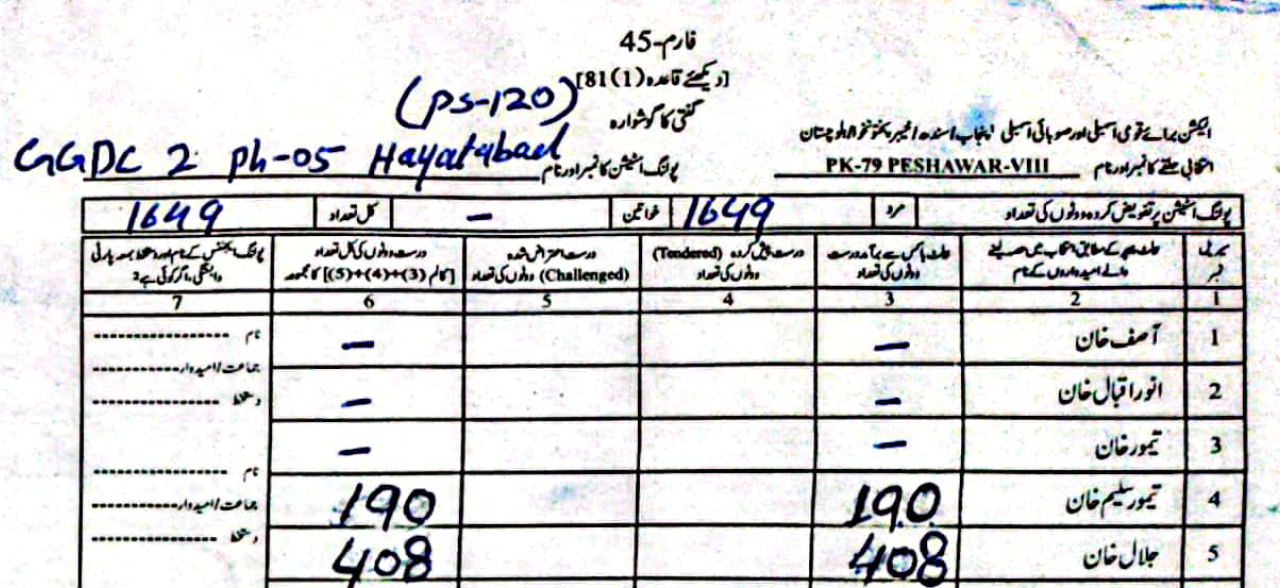
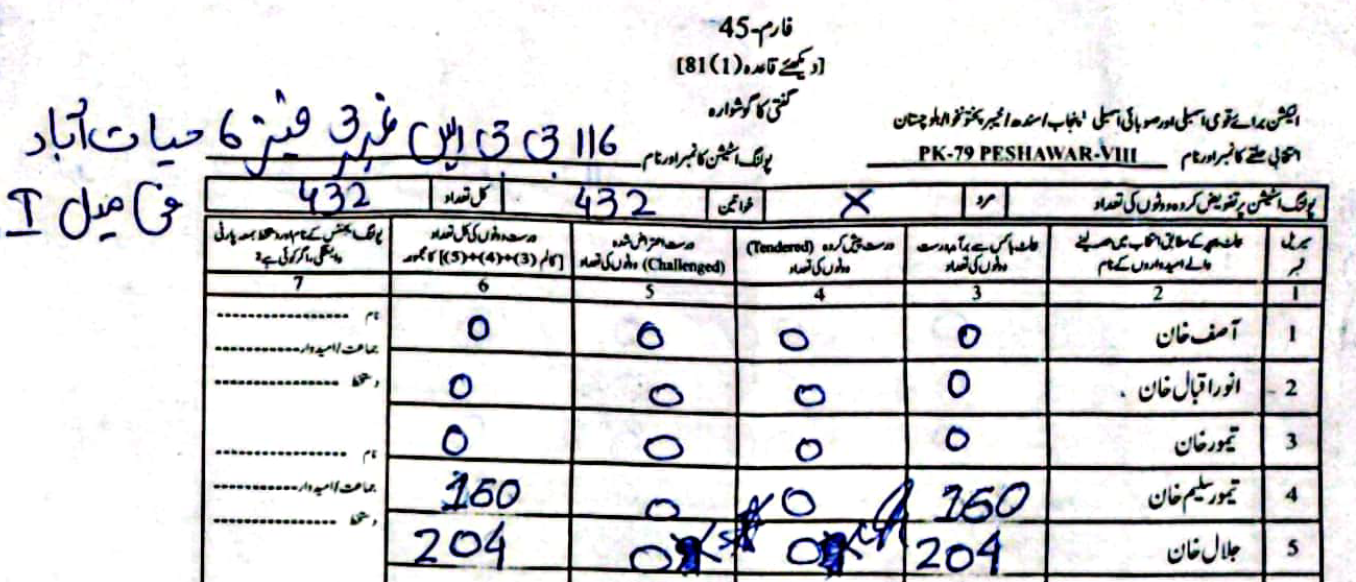
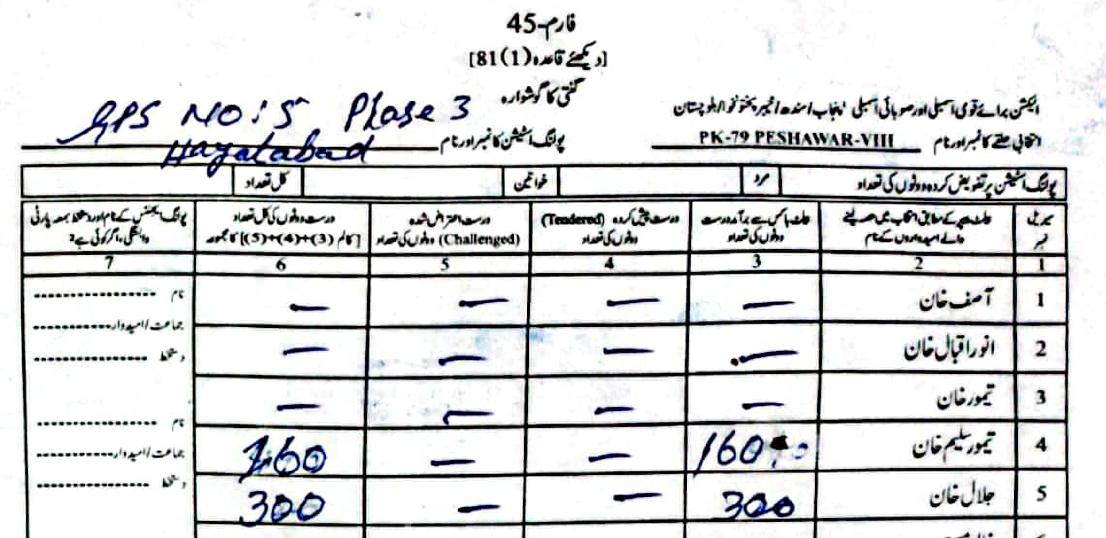
Last week (05-03-2024) the Election Commission of Pakistan (ECP) finally uploaded the Result of Count Forms (Form 45s) for the Feb. 8 Elections. In any healthy democracy — like Pakistan's — transparency is always a good sign.
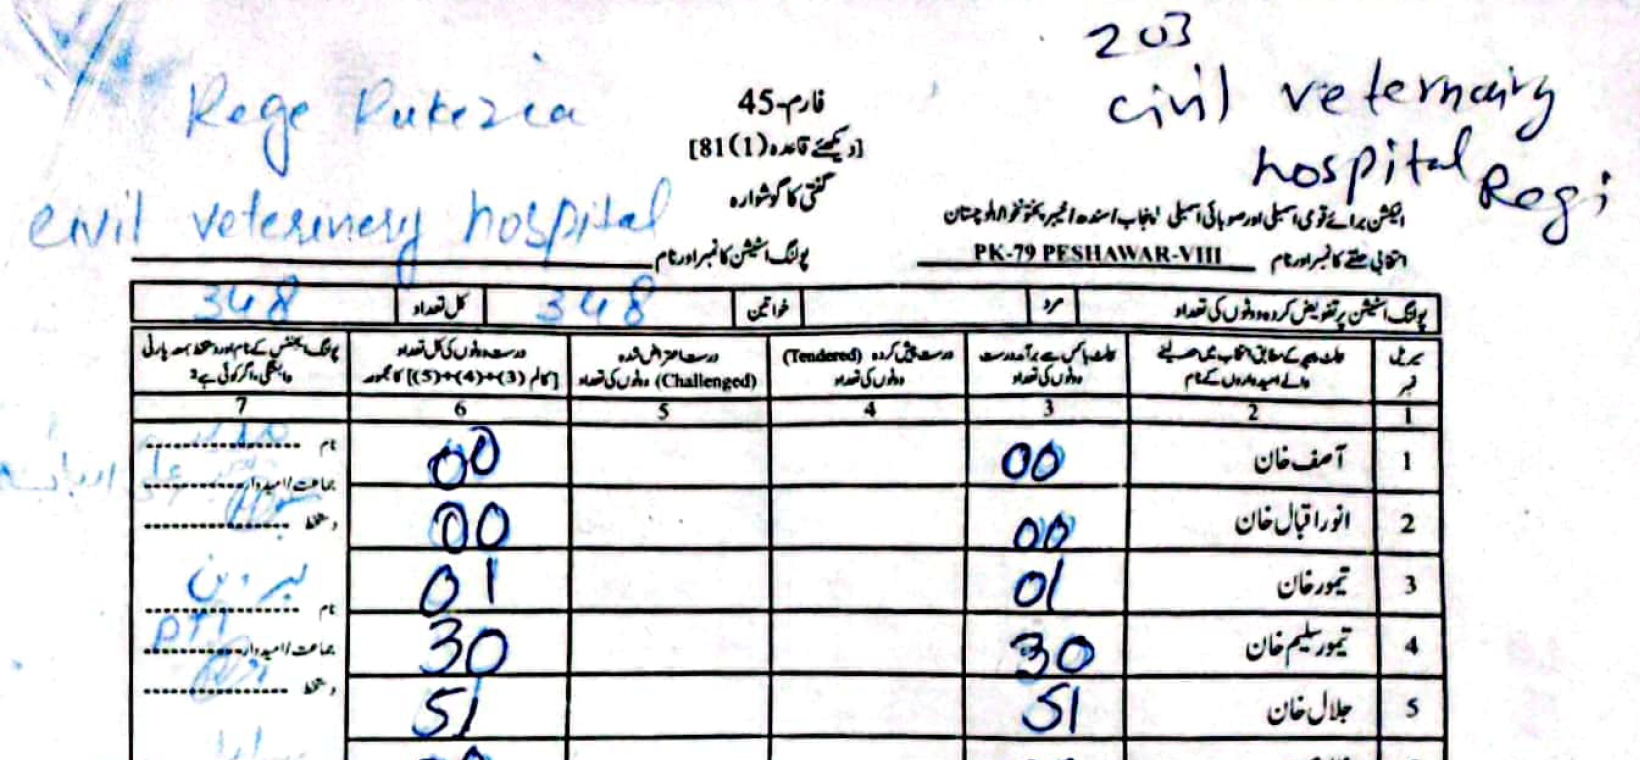
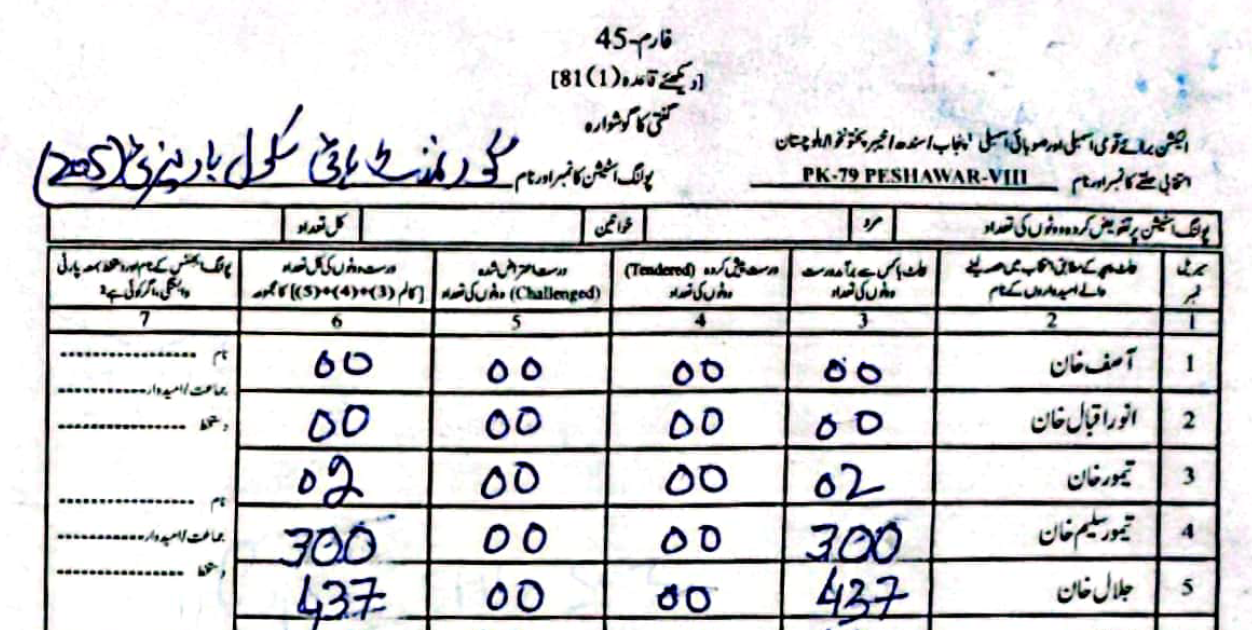
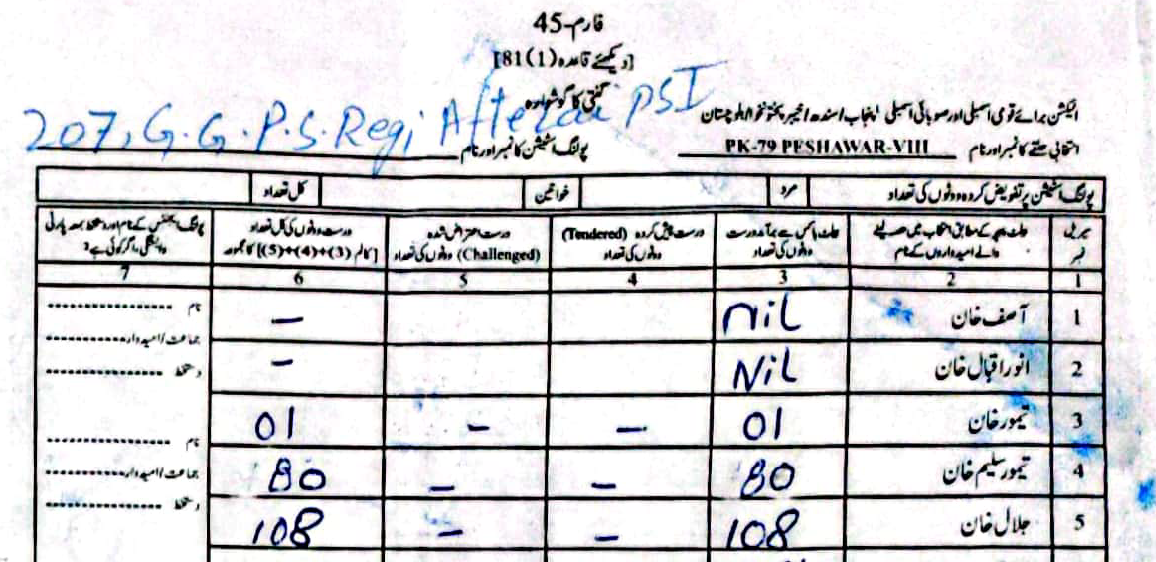
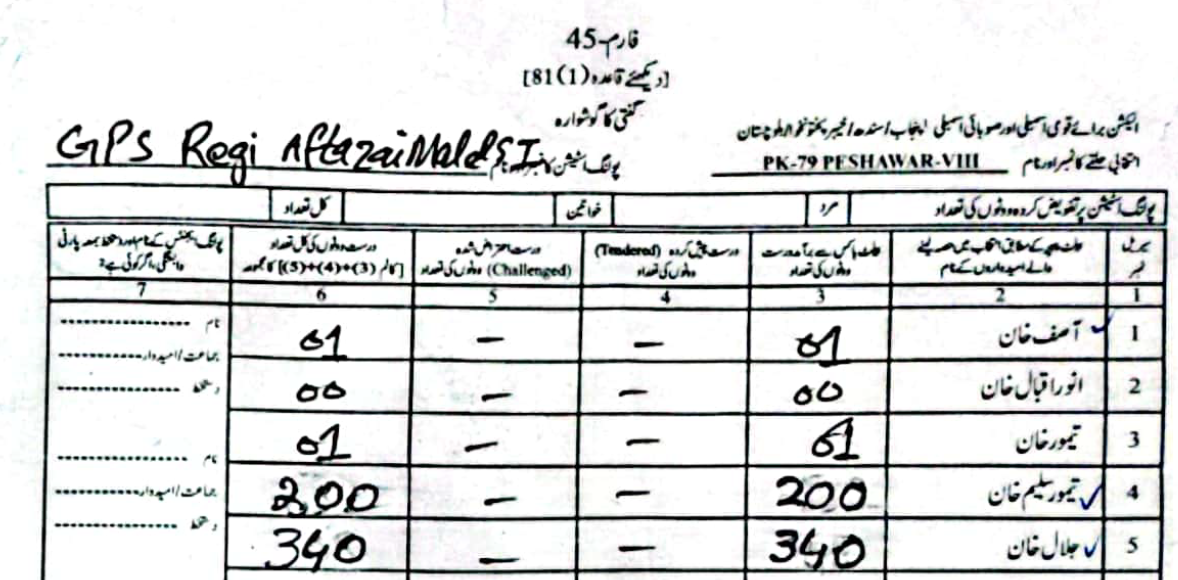
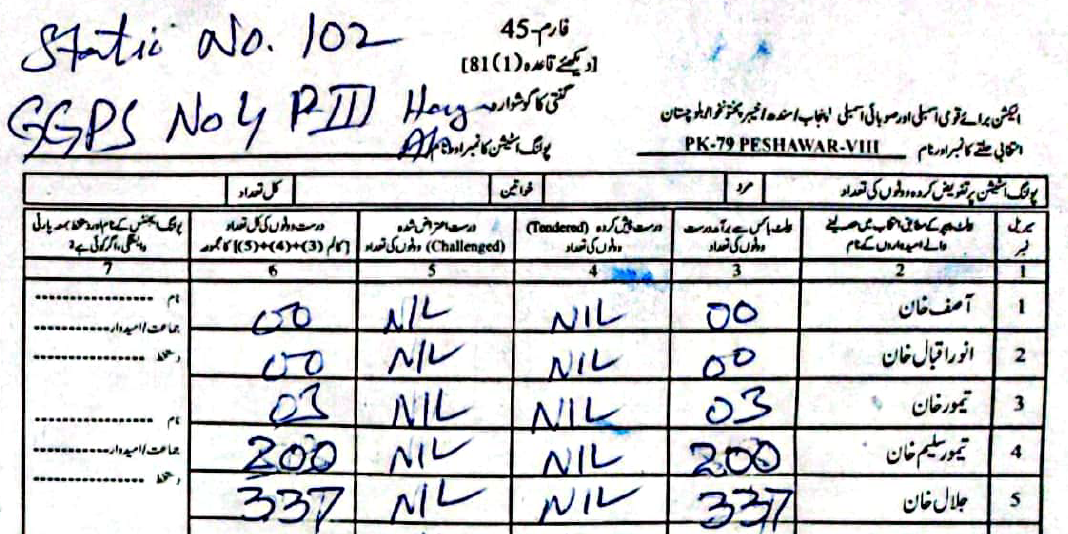
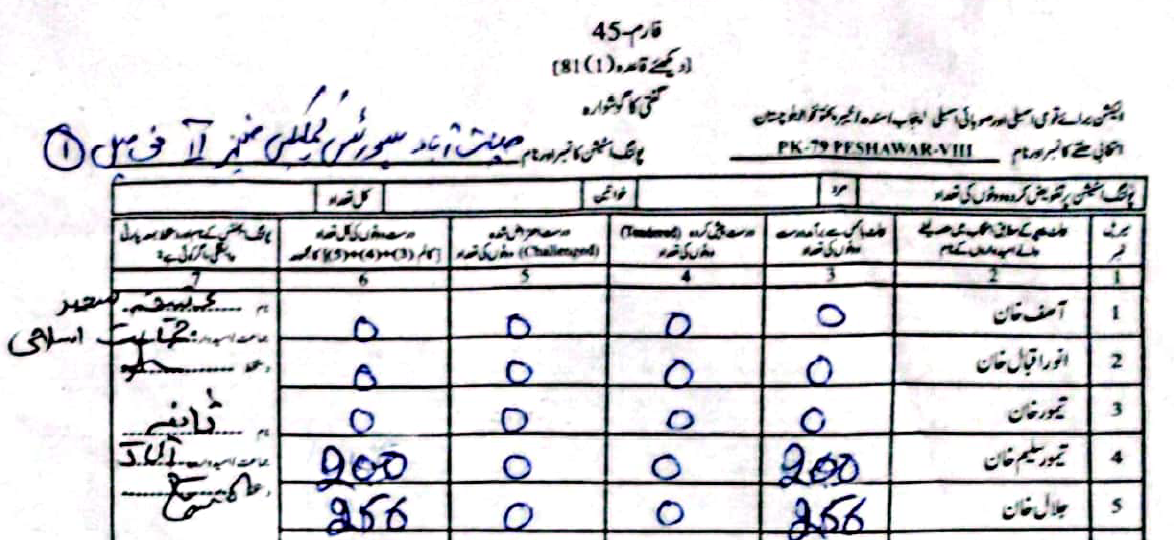
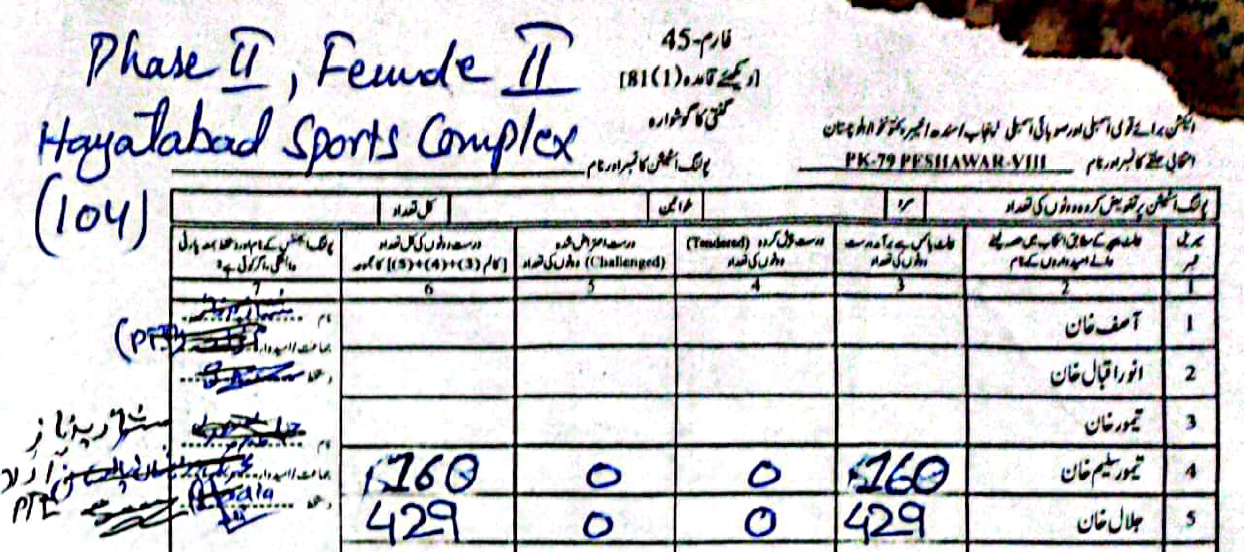
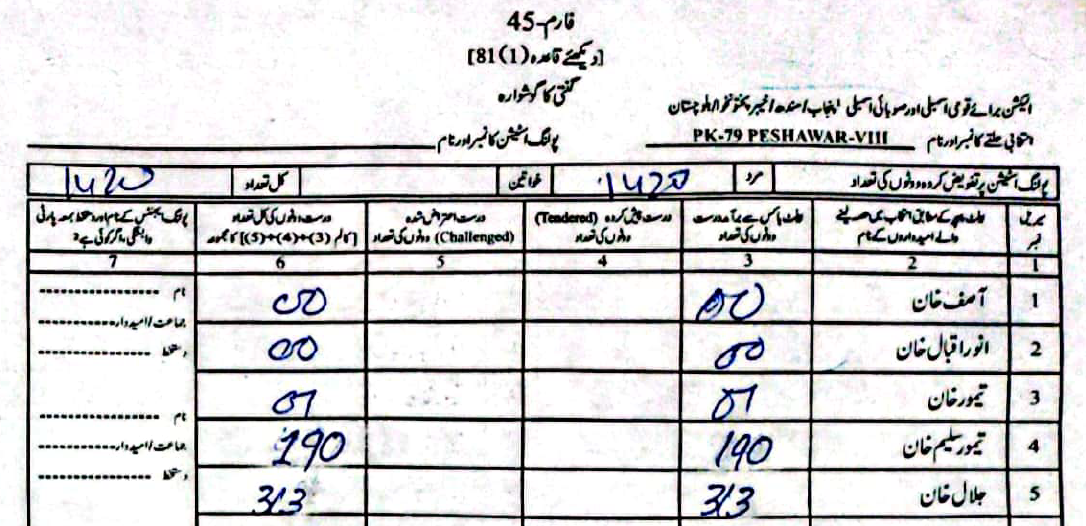
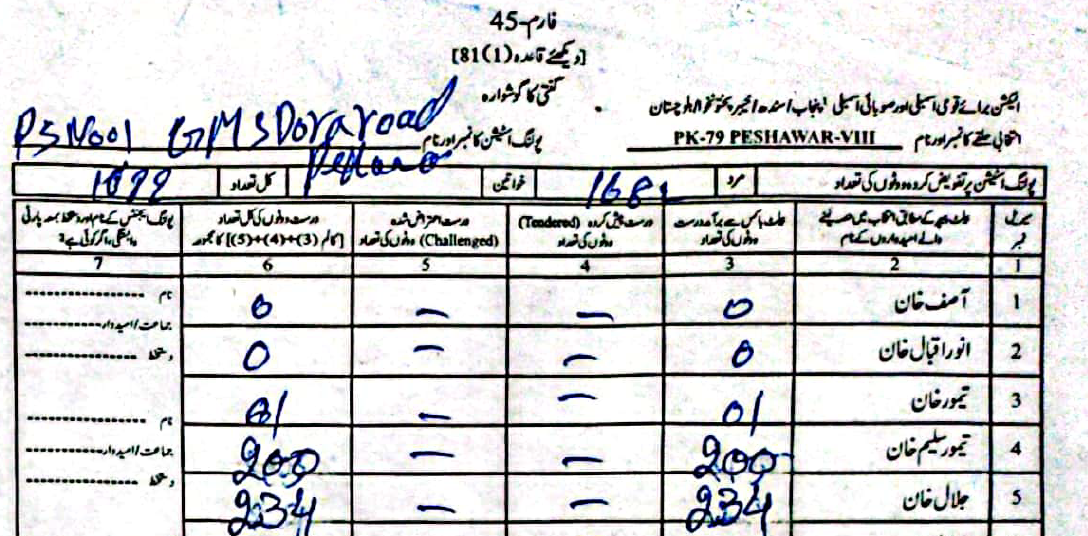
Now we can finally look at some forms and see what's happening:
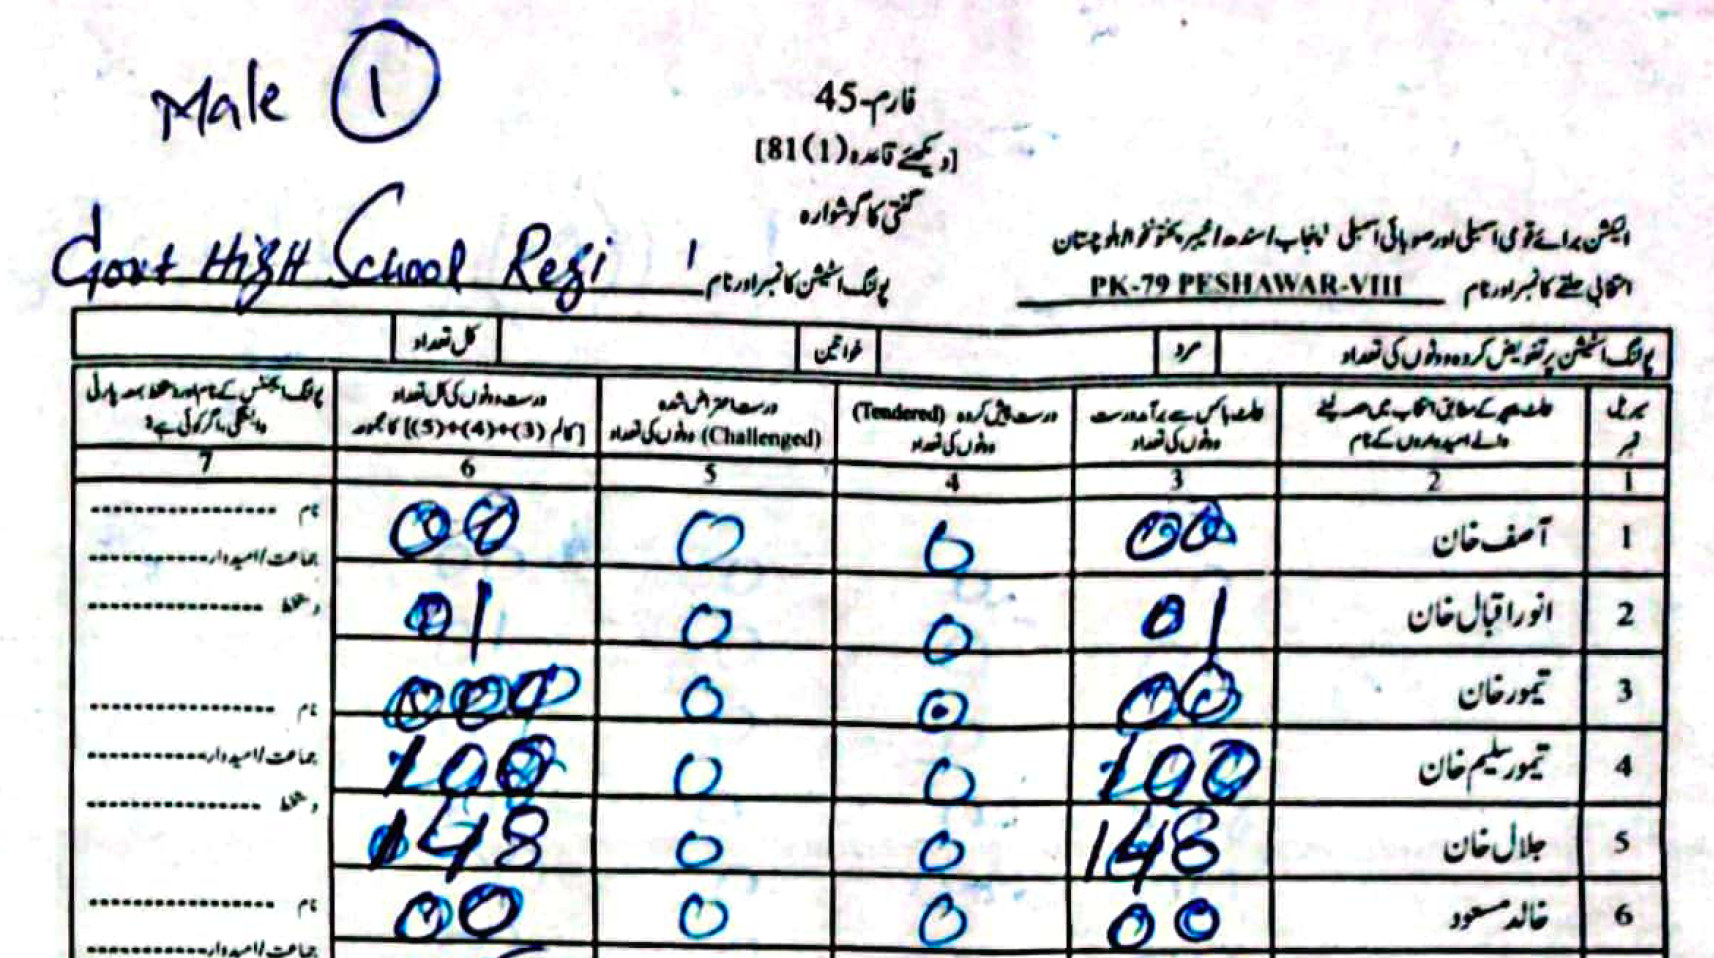
Now if you were a cynic, you might have noticed modifications on the forms and might immediately think “Election Rigging”. But if you were an optimist like me, you would never think that an institution like the ECP, a bastion of the democratic process, would ever be complicit in something like “Election Rigging”. Maybe some Returning Official (RO) made a mistake and the modifications are just them correcting those mistakes. There is precedence to such modifications. Look at the Form 45 for PK-73 from the 2018 elections.
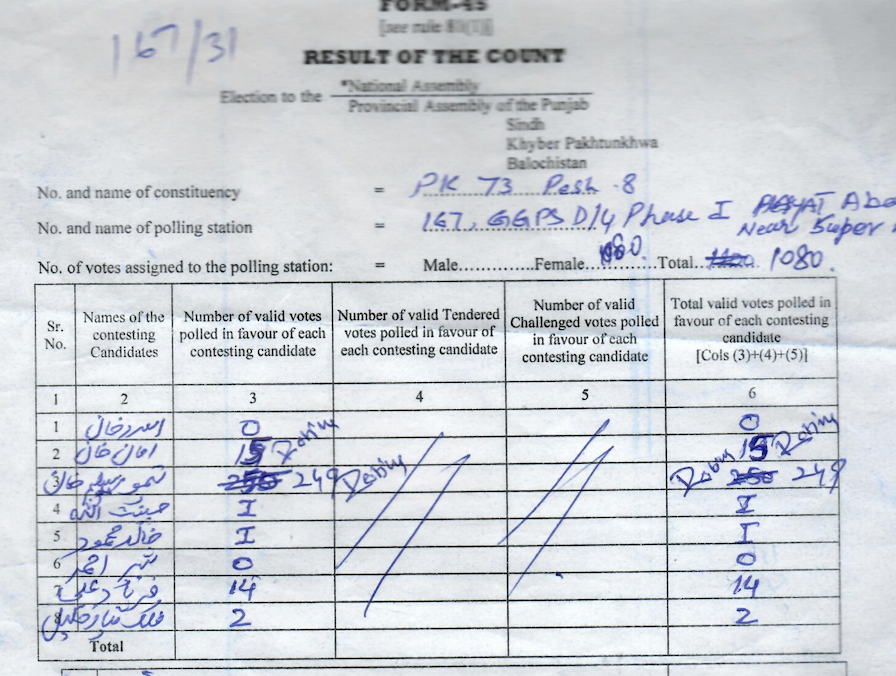
Okay, you might want to argue that the 2018 example I uploaded is different, the returning official has signed off on the change. However, I would still like to give the ECP the benefit of the doubt. There were over 90,000 polling stations all over the country, some officials were bound to make mistakes, maybe someone just forgot to sign off on the modification.
We can't really prove that there was rigging just because there were some modifications to some of the forms. Or can we? More specifically, can we devise a mathematical method to audit form 45s to detect deliberate rigging.
A Definitional Segue:Electoral rigging comes in many shapes and sizes. The most well known one is ballot stuffing, where votes are casted for a particular candidate by people that may or may not exist. One alleged example of ballot stuffing took place in the 2002 referendum.
When people think of election rigging they are generally thinking of ballot stuffing. In this article we want to focus on a different form of electoral rigging: Vote Flipping, where you vote thinking you have voted for Candidate A but later on it turns out that your vote was allocated to Candidate B.
Scope of this Article:The method we use should work for any constituency, but in this article I want to focus on just one election: PK-79 Peshawar VIII (You are encouraged to try my approach for other constituencies).
The election in question was between Taimur Saleem Khan Jhagra and Jalal Khan. Taimur Jhagra is the former Health and Finance Minister of KP during the 2018-2022 cycle. During his tenure, his impact on the health sector of KP had been quite visible. He helped implement and devise COVID protocols for the province. He also introduced the Sehat Card to KP. In contrast, Jalal Khan is a stub on wikipedia.
You would think that for all his work and name recognition, Taimur Jhagra would easily win the elections in 2023. However, if you believe the ECP, it seems that the people of Peshawar were so sick and tired of all the good things Taimur had been doing for the province that they decided they wanted change and elected Jalal instead. Or conversely you can ask whether something else has happened. I am not a political scientist nor do I make any claims to being an expert on the psyche of the residents of Peshawar VIII.
مجھے تو بس تھوری سی میتھ آتی ہے- [5]
[translation]And using that little maths, let us try to figure out why Taimur lost such an easy seat.
Background:- The section contains maths.
- The background section introduces some Probability Theory. If you are already comfortable with basic probability you can skip that section.
- If you are allergic to maths and during the article you experience any of the following symptoms: Headaches, Nausea, Vomiting, Dry Mouth or Indigestion please contact your doctor.
Let's say you have a coin with 2 sides — heads and tails. If the coin is fair and you flip it, the probability of it coming down heads, is the same as the probability of it coming down tails (i.e. a one in two chance or \(\frac{1}{2}\) ). We can write it as follows:
Probability of Head: \( P(H) = \frac{1}{2} \)
Probability of Tail: \( P(T) = \frac{1}{2} \)
If you flip this coin the probability of it landing either on its heads or on its tails is \(P(H)+P(T)=1\) (your coin can't land on any other side)
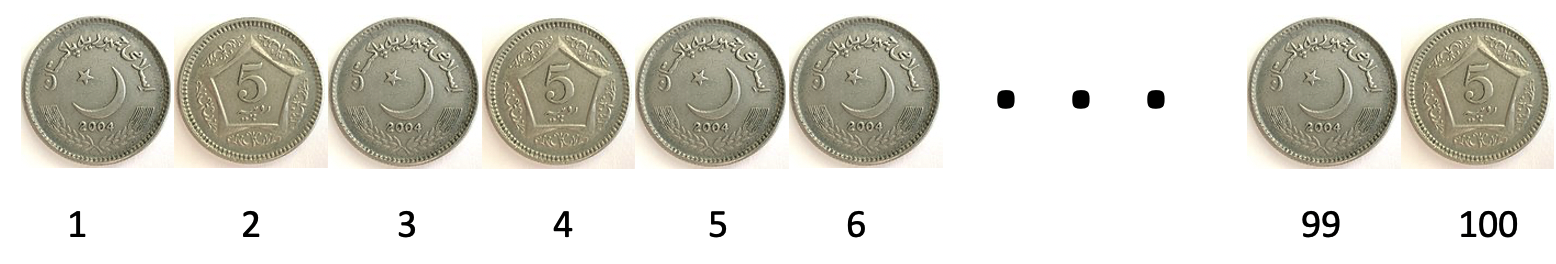
If you were to flip this coin \(100\) times, you would expect that on average it would land heads almost half of the time \((50)\) and tails the other half \((50)\) [The order doesn't matter].
Note: We don't care about the order of heads or tails, we just need the total count.
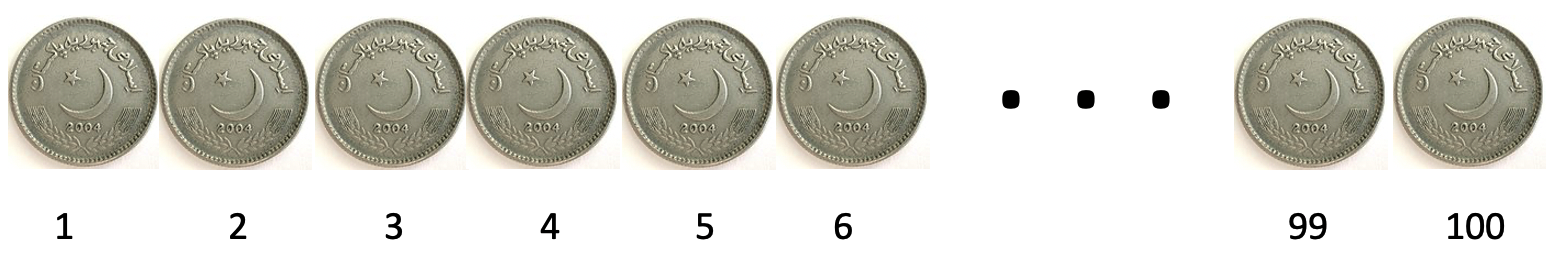
Now let's say I take out a new coin and claim that it is a fair coin. I flip this coin 100 times and it lands heads 100 times, you are well within your right to question my claim of fairness.
Intuitively it feels like there is something off and something improbably has happened. Let's try to put some numbers around our intuition.
Let's see what the probability of getting this outcome is
or there was a one in one-nonillion chance of me flipping the coin and it landing heads \(100\) times. In comparison the probability of you getting pulverized by an asteroid are one in \(1.6\) million and the probability of stepping on the moon are one in \(3\) billion.
You have a better chance of getting getting pulverized by an asteroid on the moon (around one in a quintillion) than I had of landing \(100\) heads.
Now that we know what bias looks like, we can move on to evaluating it in a more statistical way.
Chi-Squared Test:In statistics, we can use a Chi-squared test to evaluate the fairness of this coin.
More specifically the Chi-squared test will test us the \(p\)-value or the probability is that the event we observed was just random chance.
From statistics we know:Here \(\chi^{2}\) is the Chi-square metric, \(E\) is the number of events we expected, in our case, if we flip \(100\) coins we expect \(50\) heads and \(50\) tails. and \(O\) is the number of events we observe (in our case we observed \(100\) heads after \(100\) flips and \(0\) tails). And \(\Sigma\) is the summation function, we we need to calculate \(\frac{(E-O)^{2}}{E}\) first for one possibilty (heads) than the other possiblity (tails) and add the values. We can rewrite the expression as:
We have a \(\chi^{2}\) value of \(100\) for our example, we can now use a chi-squared distribution table to look up the \(p\)-value for this \(\chi^{2}\) value (or use an online calculator to do the same) .
In our case our \(p\)-value is \(0.00001\) i.e. there is a \(0.001\%\) chance that the event we observed was because of random chance. SInce this \(p\)-value is less than \(0.05\) we can say that the distribution generating our original unfair coin flips did not generate this 100 head coin flip. And you can definitely accuse me of giving you an unfair coin.
If we want to connect this to the election in PK-79, we are basically trying to figure out whether the modifications on the ECP's form 45s were a result of just random chance (i.e. some ROs making mistakes) or was there a deliberate and systematic attempt at fudging the forms (i.e. the mistakes were deliberate and the coin was biased).
The Unit Digit Test:The probabilities of coins are fun, but let's now shift gears and focus on something that is more real-world. Let's say you and I are watching a cricket match and I ask you to guess the unit digit on the scorecard of the team batting first at the end of their inning. If we are watching the PSL match between the Lahore Qalandars and Islamabad United, and after the \(20^{\text{th}}\) over the scorecard reads \(7\)-\(162\), then the unit digit of this score is \(2\).
Now we can ask, what is the probability of getting a unit digit of 6 at the end of the first inning in an arbitrary match?
Since there are \(10\) digits, \(0\) to \(9\), and if we assume the likelihood of each digit occuring is the same, then we can say there's a one in 10 chance (\(\frac{1}{10}\)) of getting a 6 in the unit digit[1].
The unit digit test states"the last will occur with equal frequency for a large class of theoretical distribution"[2].
Note: This won't be true if I had asked you about the probability of the leading digit. In a T20 match, you are more likely to have a \(1\) in the leading place than say a \(4\) (Teams generally score between \(100\)-\(200\) in T20s, rarely do they post scores in either the \(400\)s or the \(40\)s).
Let's see whether the unit digit test holds true for the PSLs from the previous years. Focusing on the 2022 season, we expect that there is an equal chance of each number appearing in the unit place. In practice, we are looking at 34 matches in the 2022 season, so we would expect that each digit occurs around \(3\) to \(4\) times (on average \(3.4\) times), but because of randomness there might be some deviations.
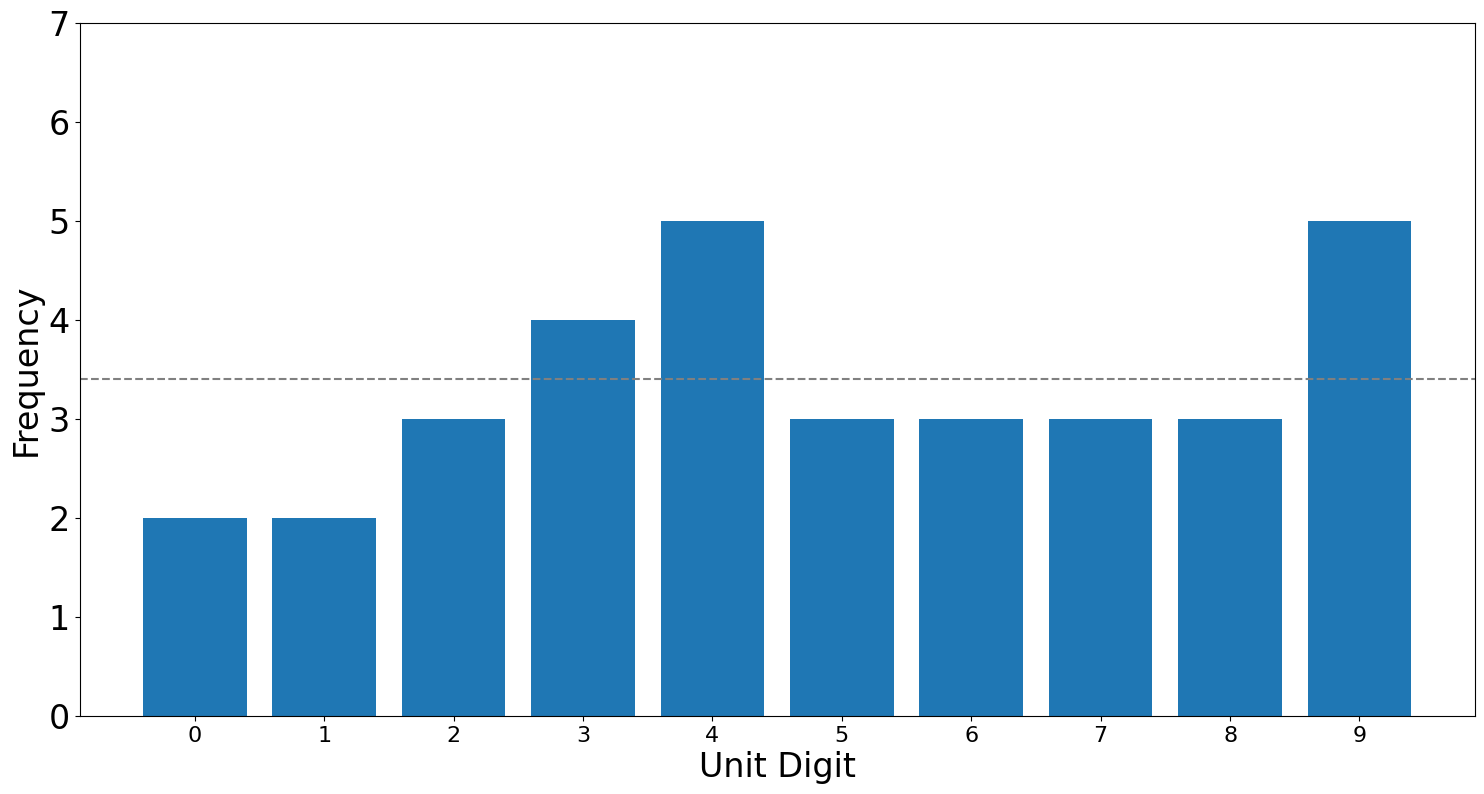
Looking at the figures we see that our hypothesis does hold true for the 2022 seasons. And the \(p\)-value = \(0.92\) of the Chi square test of the distributions supports the idea that the distribution is similar to a distribution stemming from a uniform random distribution.
Let's say there was match fixing in the PSL, and someone was trying to manually adjust the match scores. What would you think would happen?
Although we would expect that the score cards might have equifrequent last digits, however people aren't good at producing random patterns even when they have the incentive to do so[2]. We as a species just can't generate randomness so it is safe to assume that the unit digit test might not hold as well on the fixed score cards.
While coin flips and cricket matches are interesting, that's not why we are here. We want to know how the unit digit test looks in elections. As an example, let us look at what the distribution of the unit digits looked like in the 2020 US presidential elections.
We are going to use this data.
For each candidate, Donald Trump and Joe Biden, we are going to look at the last digit of the votes they got in each precinct and then analyze the distribution of the last digits. We are going to be ignoring cases where a candidate did not get any votes:
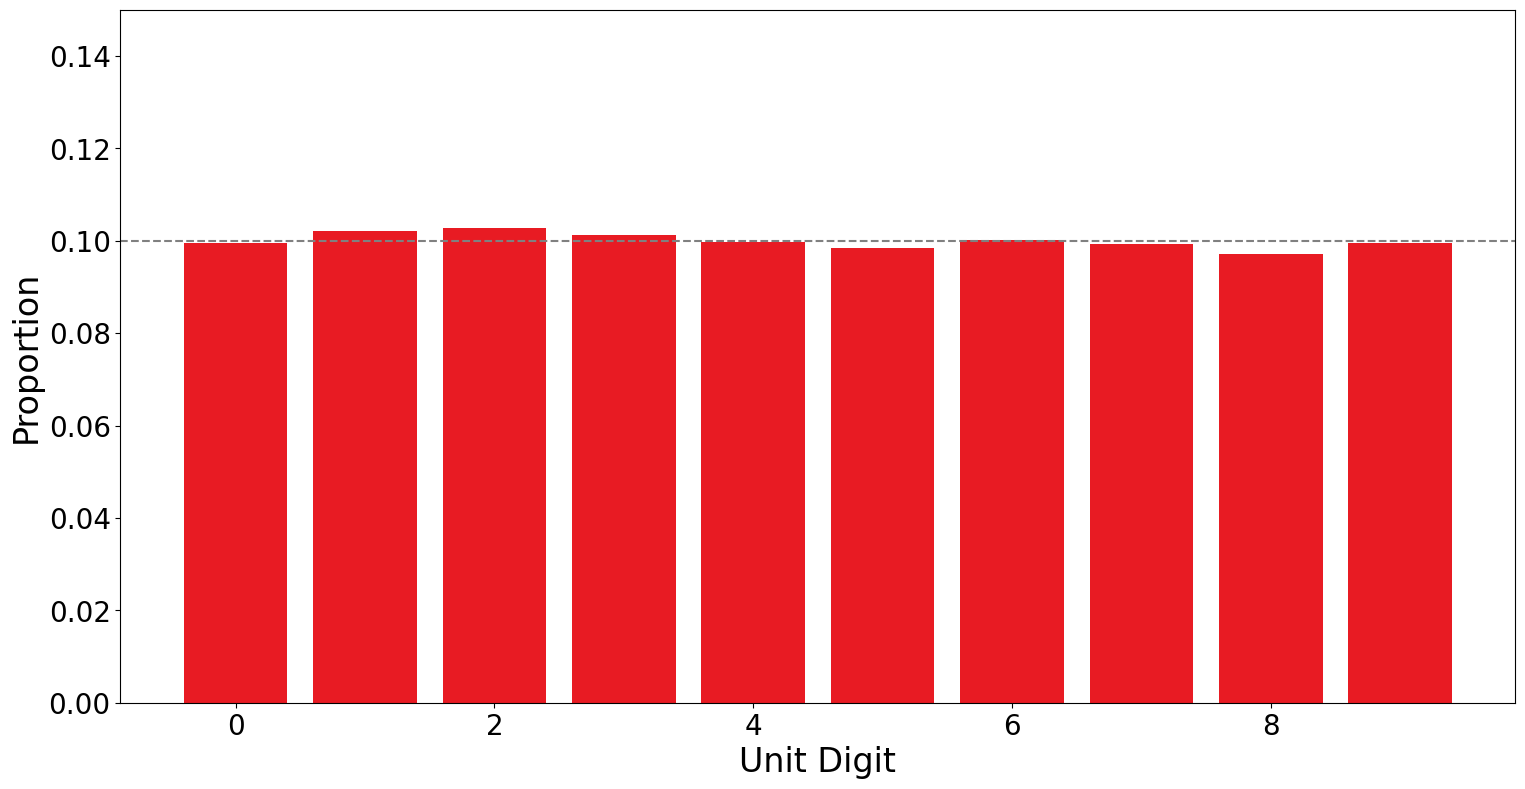
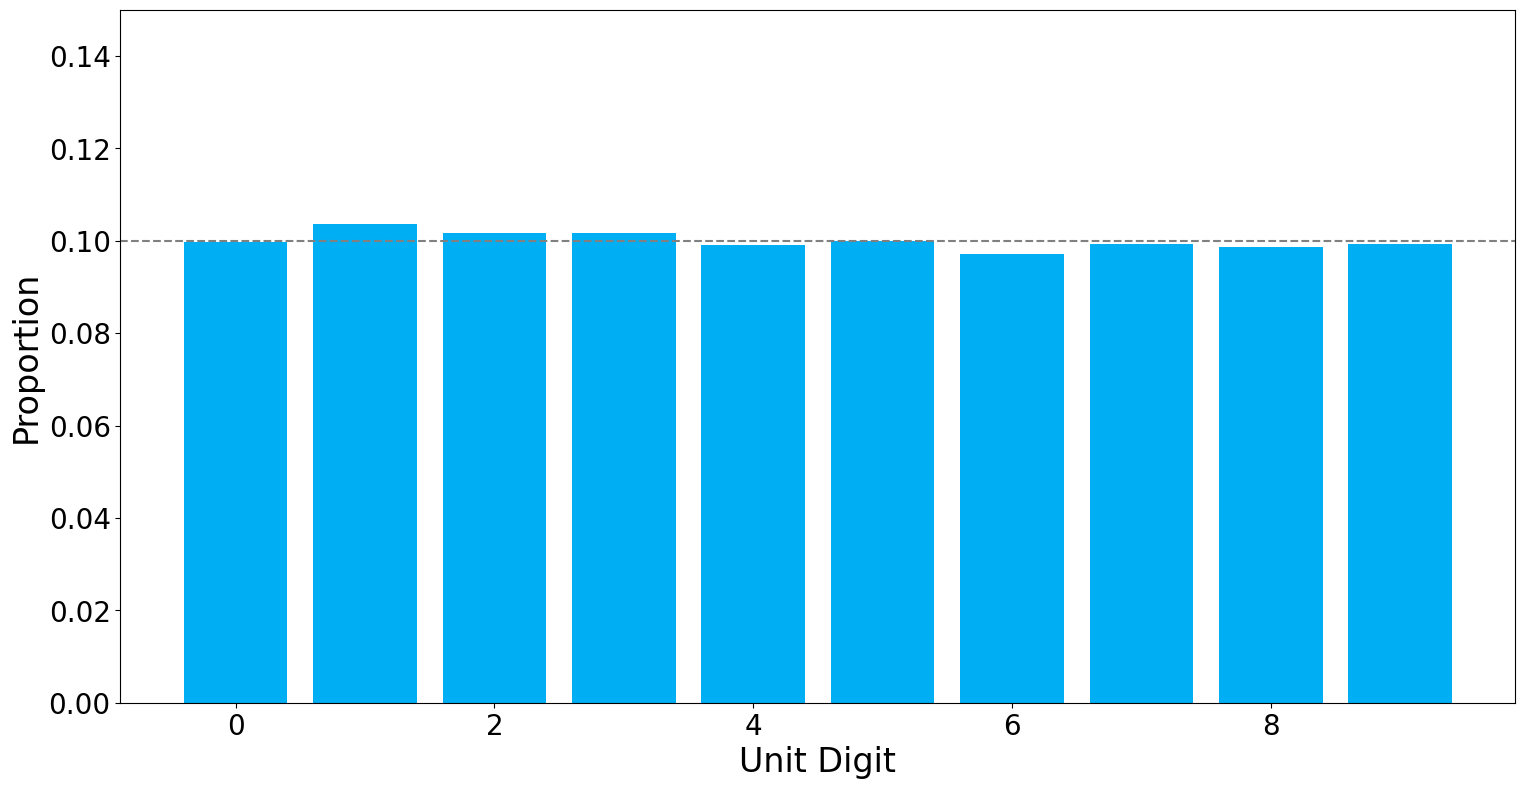
This is such a perfect example of the unit digit test. The American public voted in \(141,798\) precincts and the distribution we got for them follows our expectation (the dotted line) to the tee.
Now what claims can we make about these elections:
- We can quite confidently say that it seems at an aggregate level, there doesn't seem like there was any large scale rigging and it doesn't seem like anyone manually manipulated the election results.
- It might be that in one or two (or a very small) number of precincts there was some election rigging, but that isn't statistically significant to impact the overall results.
We ignored cases where the candidates did not get any votes. Let's say I am running in an election in South Punjab. I am not from South Punjab, No one in south punjab has even heard of me, let alone would vote for me. In that case, you wouldn't expect that the unit digits of the number of votes I will get would follow a uniform distribution, but instead what you would expect is that in almost all the cases, I would have a very high distribution of 0s (i.e. I do not get any votes) and maybe a handful of 1s (not different from random noise) in cases where someone accidentally does vote for me.
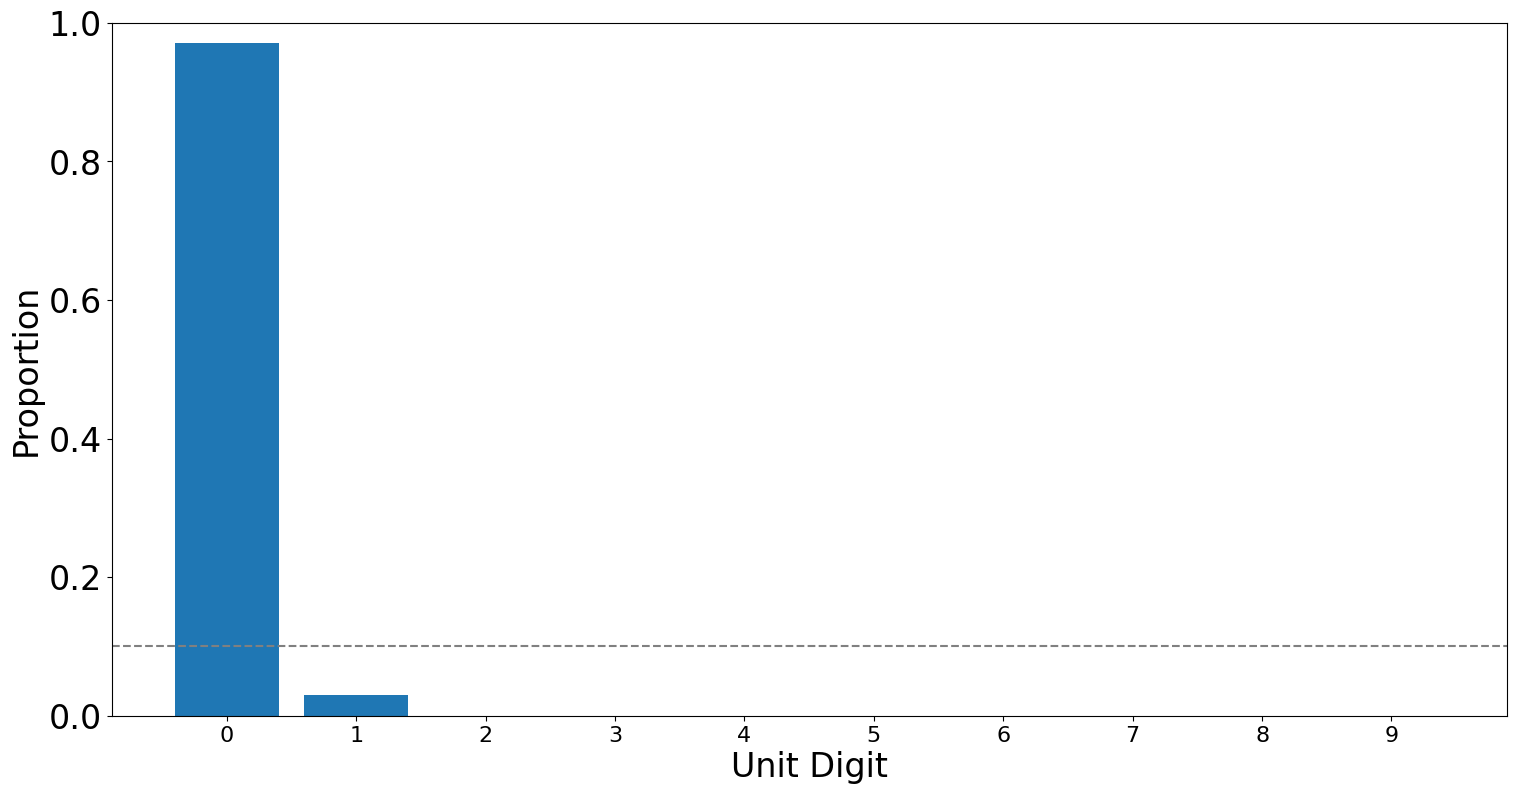
(or any place else in Pakistan for that matter).
Going back to the cricket analogy, this is the same as getting all rained out matches during a PSL season with no results and scorecards that read \(0\)-\(0\).
What happened in PK-79, Peshawar VIII:Let's say we were to collate the data from the 66 polling stations in PK-79 and were to plot the unit digits of the votes the candidates got in each polling station. If we see a distribution that is similar to the ones we saw with PSL and the US elections, then we can say with some confidence that there was no Vote Flipping. However, if we were to see something that deviates significantly from our expected distribution, then we can no longer be certain that the vote count was not modified. Note: We aren't going to be making any claims about any other form of rigging, just Vote Flipping.
The Data:We will be analyzing two datasets. One is the official Form 45s uploaded by the ECP on their website. Let's call these the ECP-forms. The other is the data the PTI uploaded on and after election night. We will call these the PTI-forms. These include photos of the Form 45s given out by the RO to the candidates as well as tabulated data representing the same forms.
The claim we are investigating is whether either the ECP-forms or the PTI-forms show signs of vote flipping.
Data Collection:We are only interested in the vote counts for Taimur Saleem Jhagra and Jalal Khan. We can also add in a third candidate Muhammad Siddique Afridi as a control.
In an experiment, a control is a standard against which the results of the experiment are compared. It serves as a baseline for our comparison with the group that we are analyzing. The control will help us determine whether the changes we observe in the two forms are due to the manipulation or are simply the result of other factors like typos and human errors.
We can manually go through the forms the ECP uploaded and transcribe the vote tally for the candidates into a spreadsheet. We did a similar thing with the PTI-Forms. Note that there is a mismatch in the polling station ids. As an example, PS-1 in the ECP form schema is PS-11 in the PTI form schema. Even though it doesn't matter for our main analysis, we can manually align the polling station ids.
The Analysis:We are going to analyze the three candidates one by one, starting with the control: Muhammad Siddique Afridi.
Muhammad Siddique Afridi (The Control):We can visualize the unit-digit distribution of the votes from the PTI-forms and the ECP forms
In both the PTI-forms and the ECP-forms, the unit-digit distribution of the candidate more or less follows a uniform random distribution, with a \(p\)-value greater than \(0.05\) (\(p=0.65\)) for the PTI-forms and \(p=0.84\) for the ECP forms).
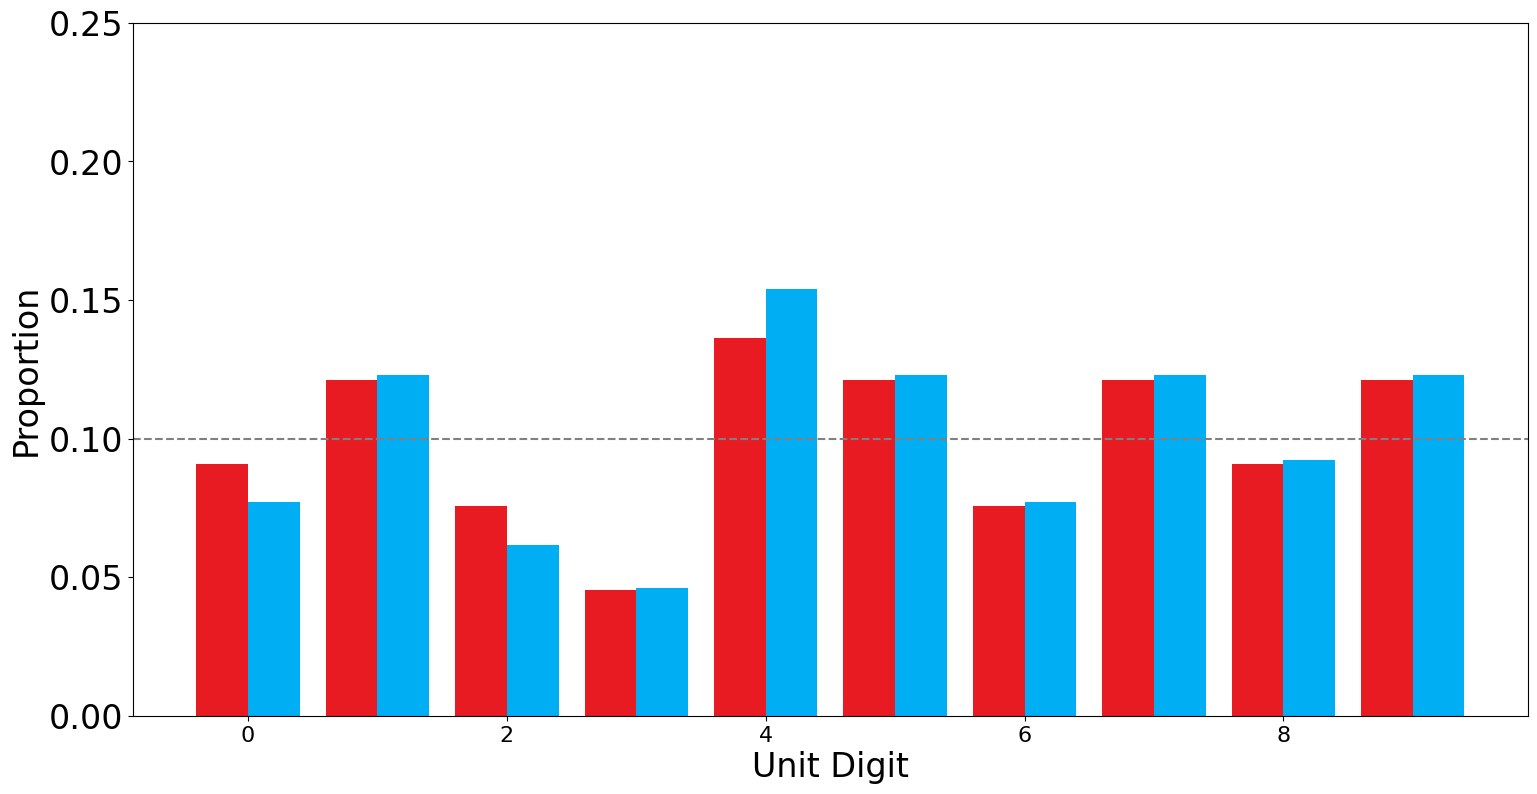
There are extremely minor discrepancies in the two distributions. That noise is well within our margin of errors.
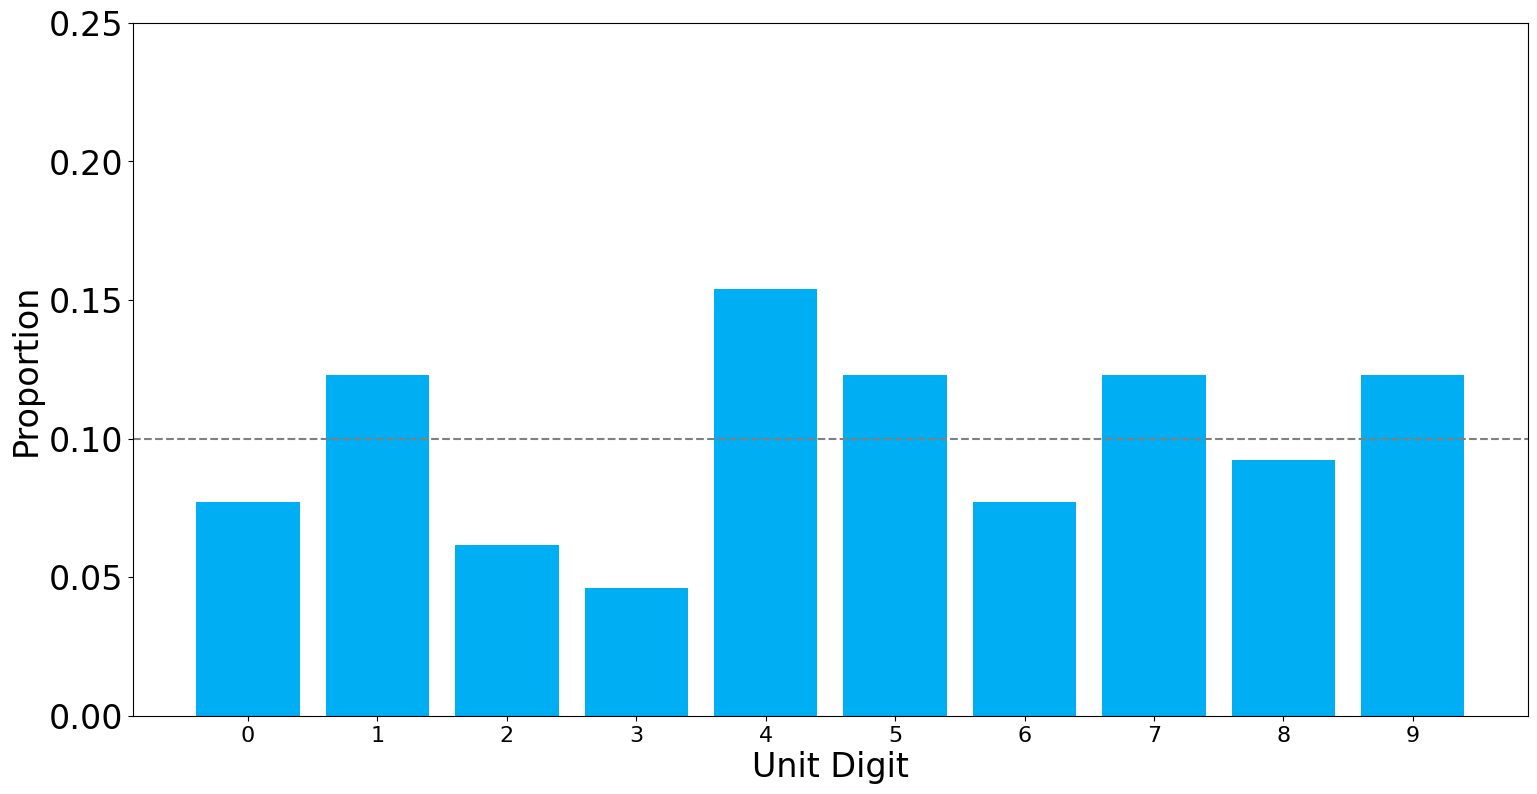
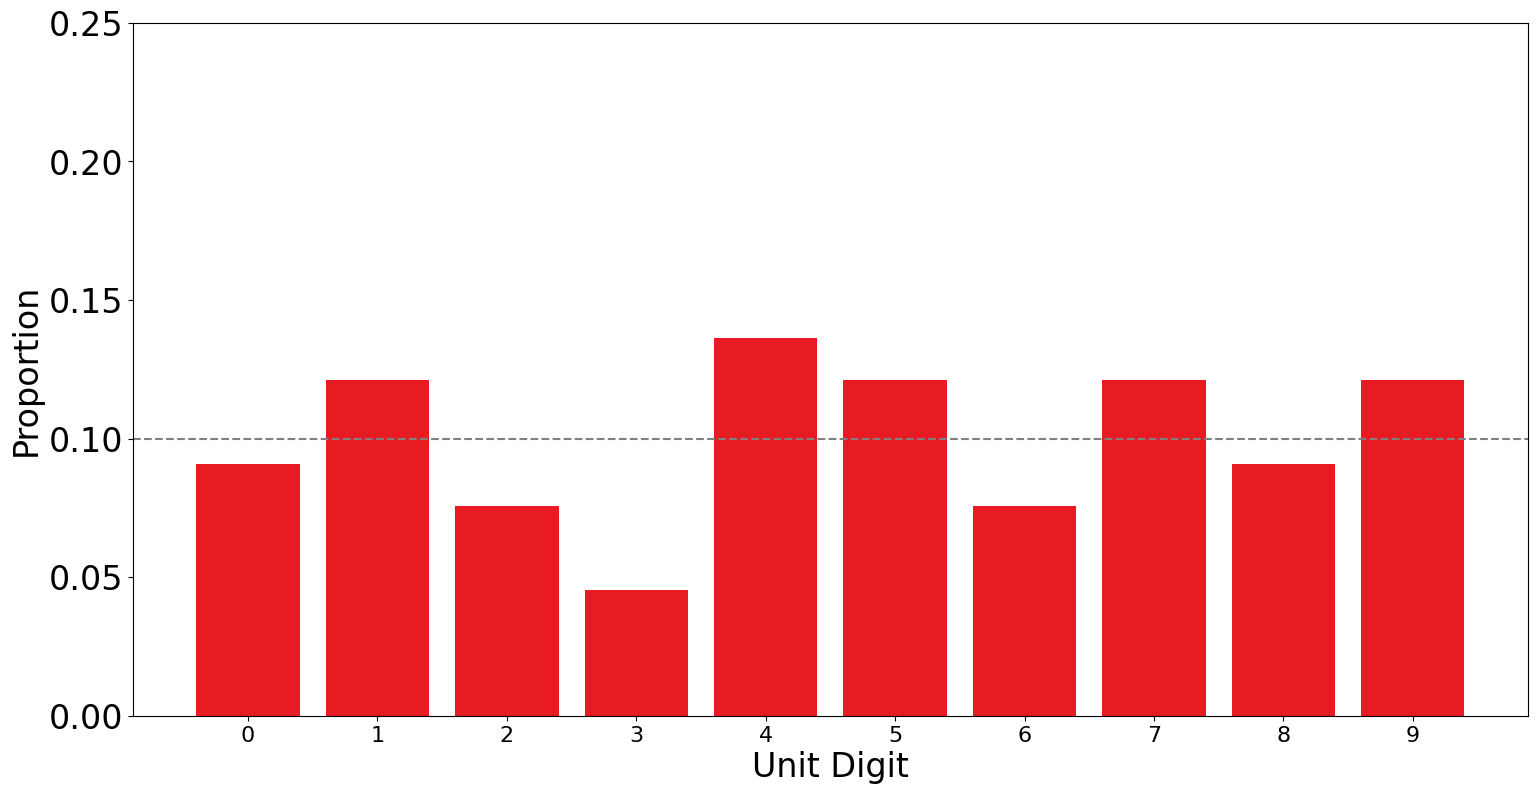
Jalal Khan:Next we look at Jalal Khan:
In the PTI-forms, Jalal Khan's unit-digit distribution is quite similar to the uniform random distribution with a \(p\)-value greater than \(0.05\). (\(p = 0.12\)).
In the ECP-forms, the distribution looks quite different. In \(12\) of the polling stations on the PTI forms(\(18\%\)), Jalal had vote counts ending in \(3\) in contrast only \(4\) of \(66\) polling stations had votes ending in \(0\) (\(6\%\)). In the ECP forms this has more or less flipped with now \(3\) of the \(66\) (\(5\%\)) of the Polling stations reporting a vote count ending in 3, and now 14 of the polling stations (\(21\%\)) report a vote count ending in 0. While this feels a bit suspicious. However, with a \(p\)-value still greater than \(0.05\) (\(p=0.18\)), this is still within our margin of error.
Putting the two distributions side by side, you might notice many discrepancies but since we have a very statistical definition of random chance, we can assume that this might be just noise and not deliberate manipulation. At this point, even if we might think that there might have been some vote flipping but if we just rely on the method proposed so far, we can't say that with statistical certainty.
Taimur Saleem Khan Jhagra:Finally we now move to Taimur Jhagra
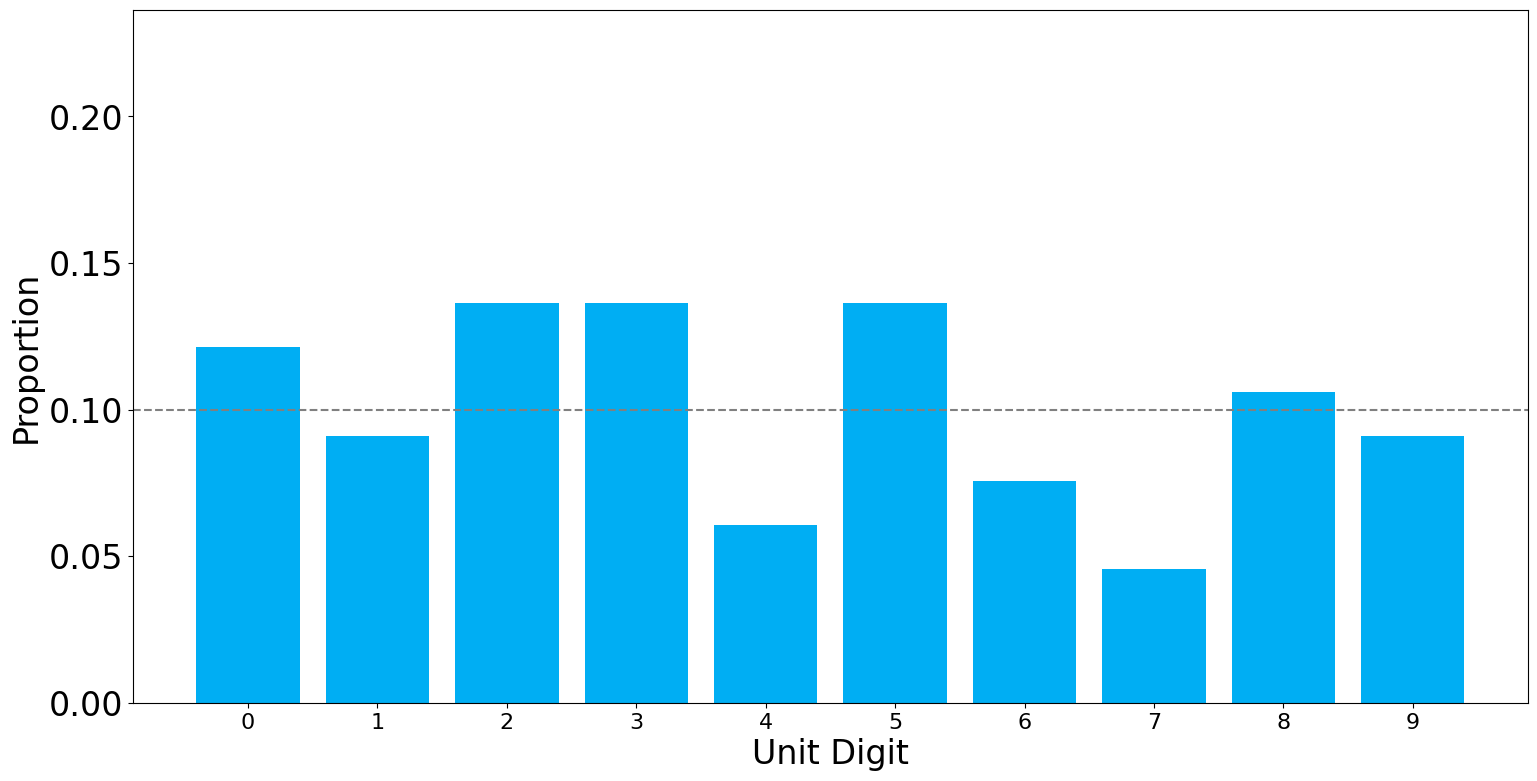
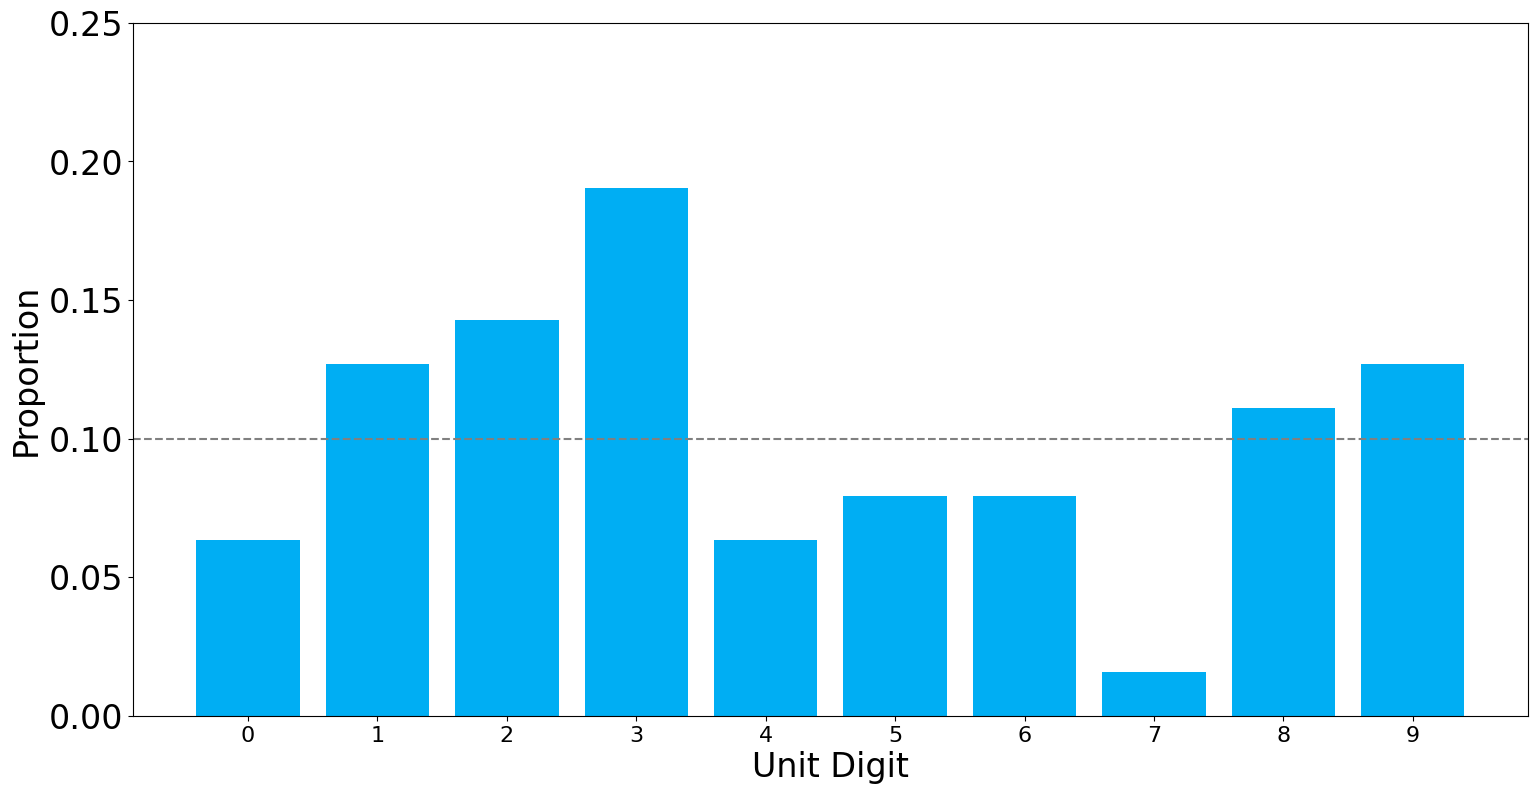
Once again the unit-distribution of the vote tally from the PTI-from looks quite similar to uniform random distribution (\(p=0.69\)). At this point we can safely conclude that the data uploaded by the PTI for PK-79, was not tampered with post-hoc.
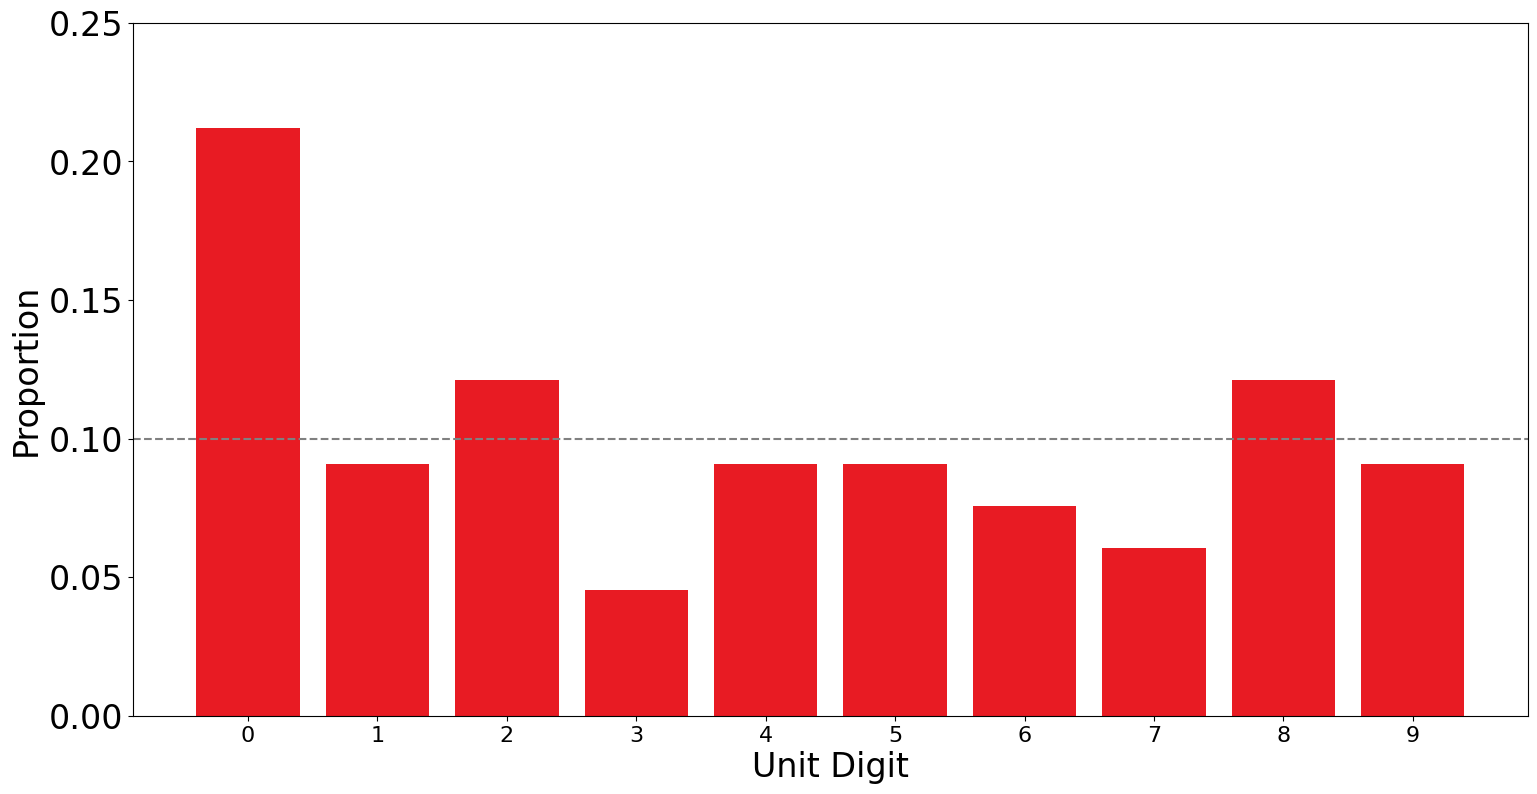
Now if we do the same for the data from the ECP-forms for Taimur.
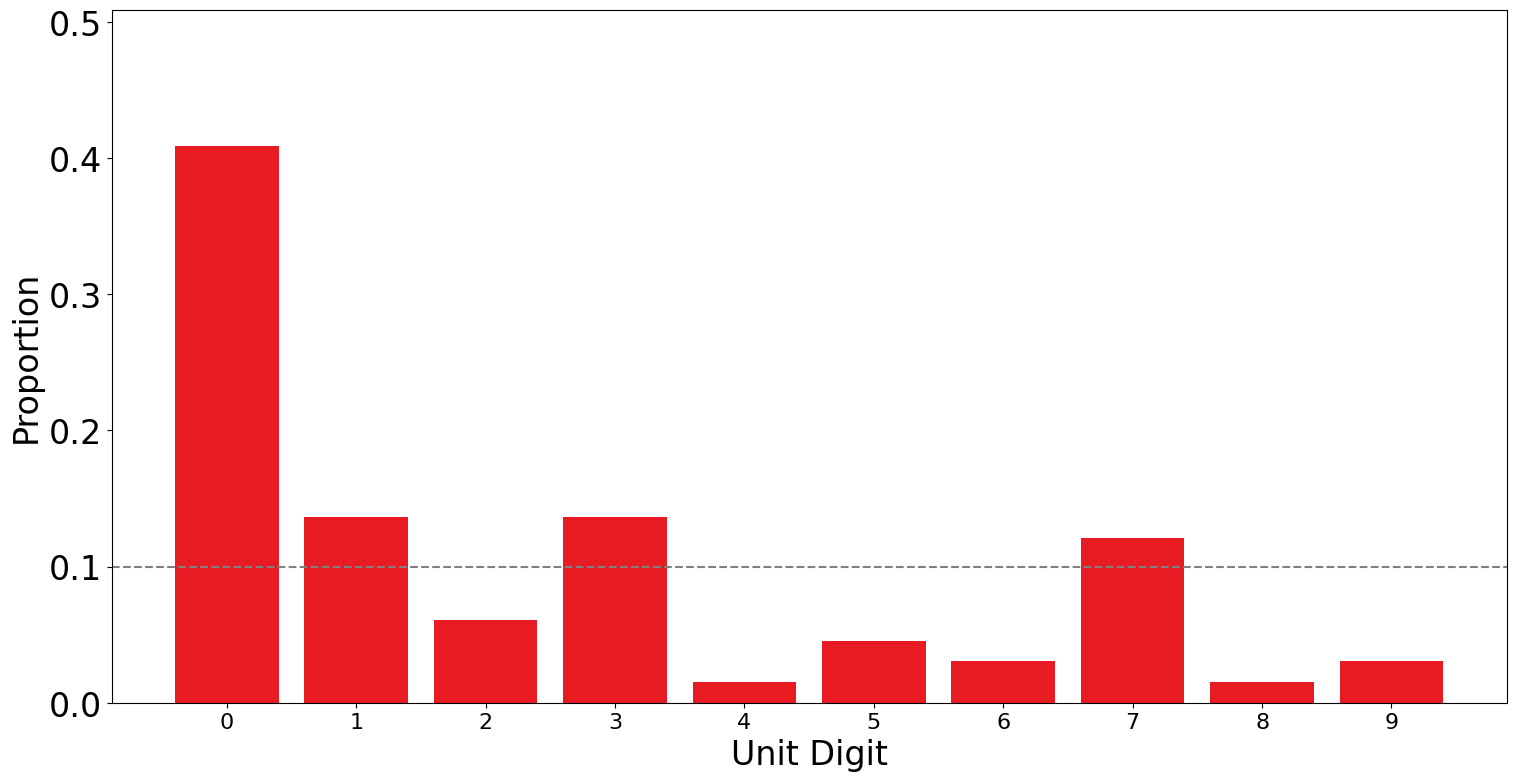
This looks extremely drastically different from what we would expect from a uniform random distribution. In fact, if you focus on the PTI forms, \(8\) of the the polling stations reported a vote count with a unit digit \(0\). This is quite close to what we expect from the Unit Digit Test (i.e. \(6.6\) polling stations reporting \(0\) in the vote count). However, in the ECP forms, now \(27\) of the \(66\) Polling stations had a vote count ending in \(0\). That is around \(40\%\) of the polling stations.
The \(p\)-value of \(2.5\times 10^{-14}\) would indicate that there is just a one in one trillion chance that this distribution is a product of random chance, and is well beyond our cut-off of \(0.05\).
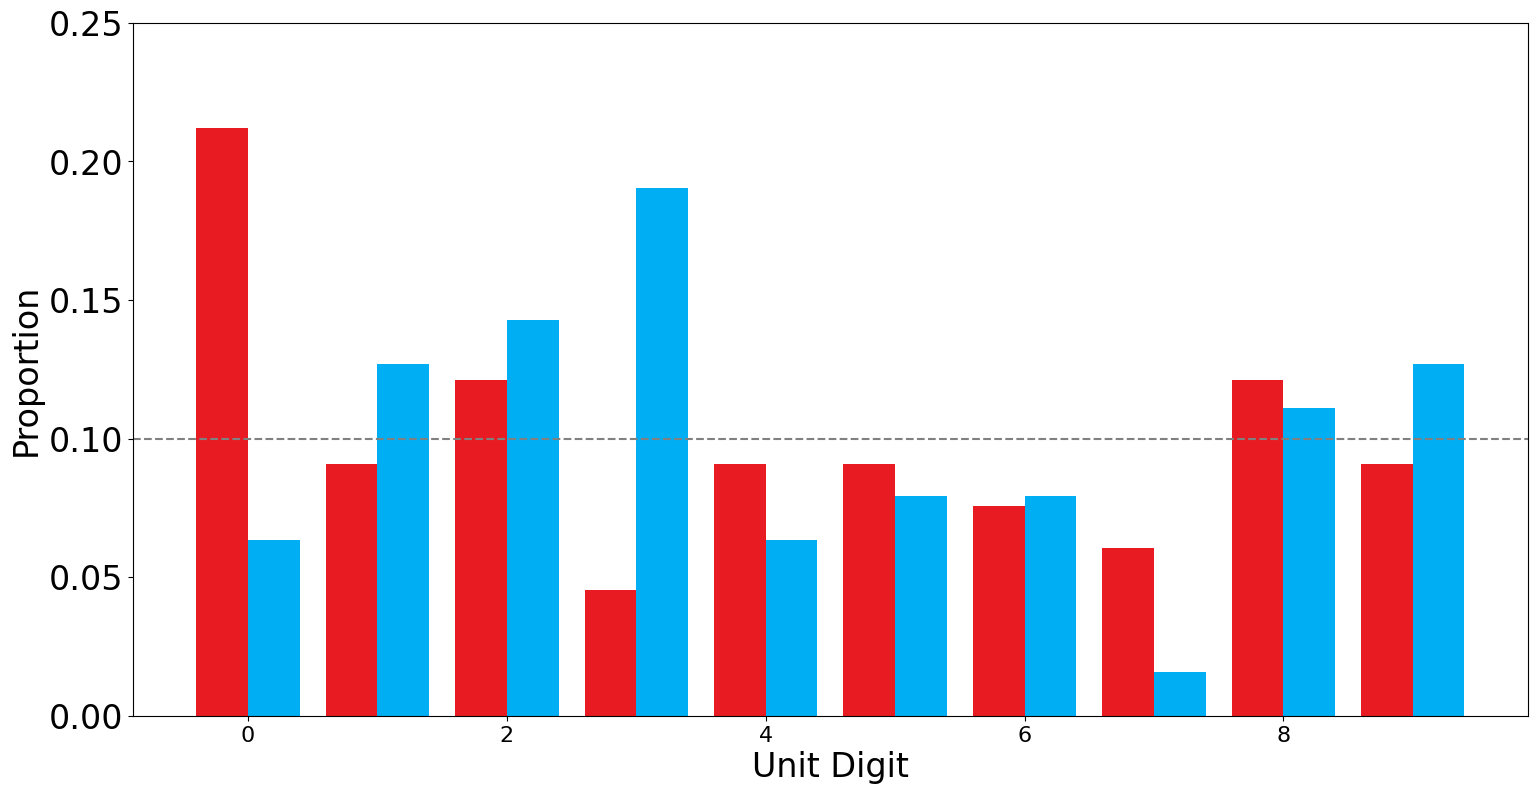
Looking at both the distributions side-by-side can give a better idea of how drastically different the ECP-form and the PTI-form results are.

Another way of looking at this result is that Taimur had a better chance of getting struck by lightning while being eaten by a shark (one in fifty seven billion)[7][8] than of having vote counts ending in 0s in \(40\%\) of the polling stations in PK-79. Note that Taimur probably lives in Peshawar quite far away from any water body with sharks.
Why is the Manipulation more Evident for Taimur than Jalal:One question that we might have is that if there is vote flipping, it should show up as evidently in Jalal Khan's results as it does in Taimur. When we go through the ECP forms, we can notice what's happening is a rounding down of Taimur's results, resulting in the excessive 0s. After the rounding down, whatever votes are gained are allocated to Jalal, leading to a somewhat skewed but still a uniform random distribution for him that is within the bounds of our margin or errors.
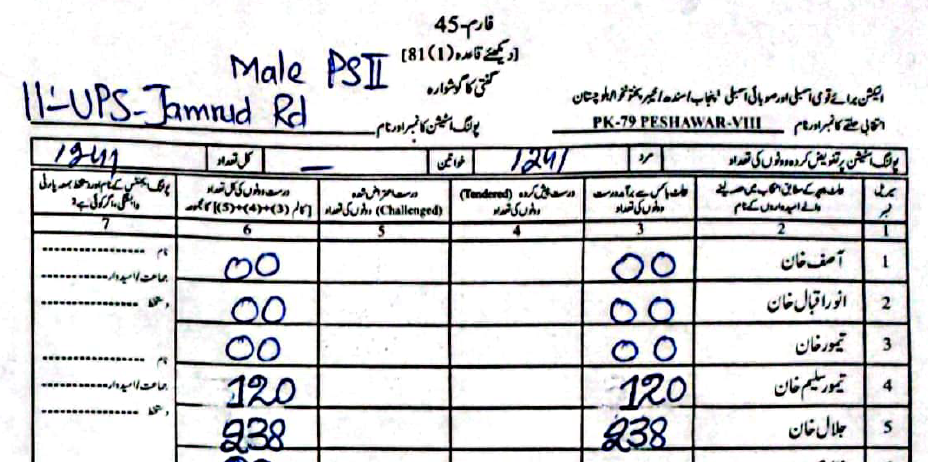
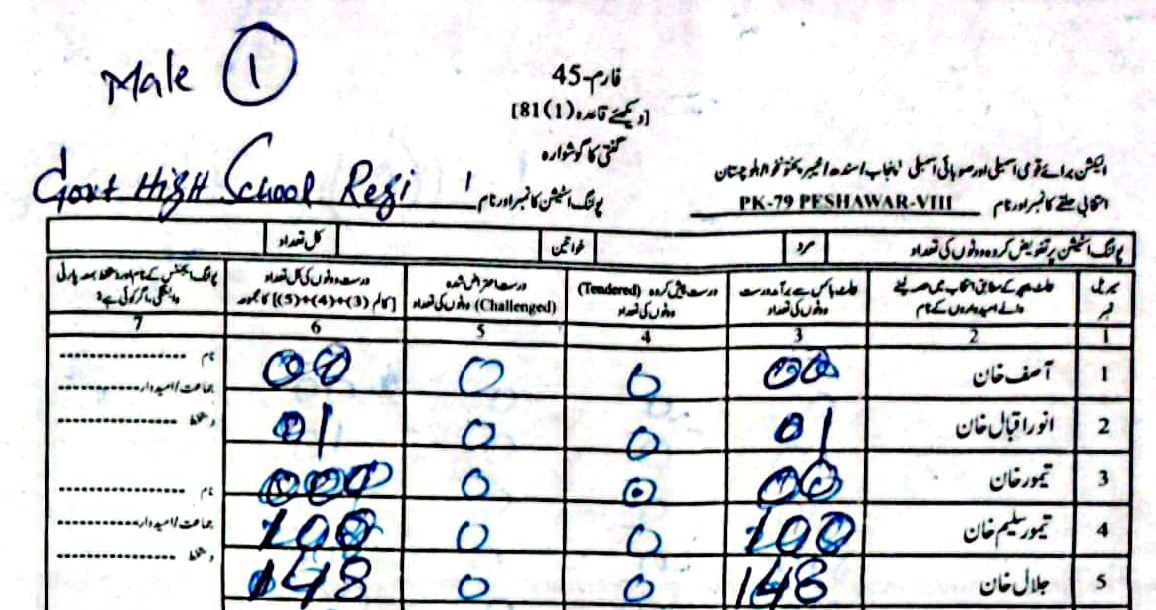
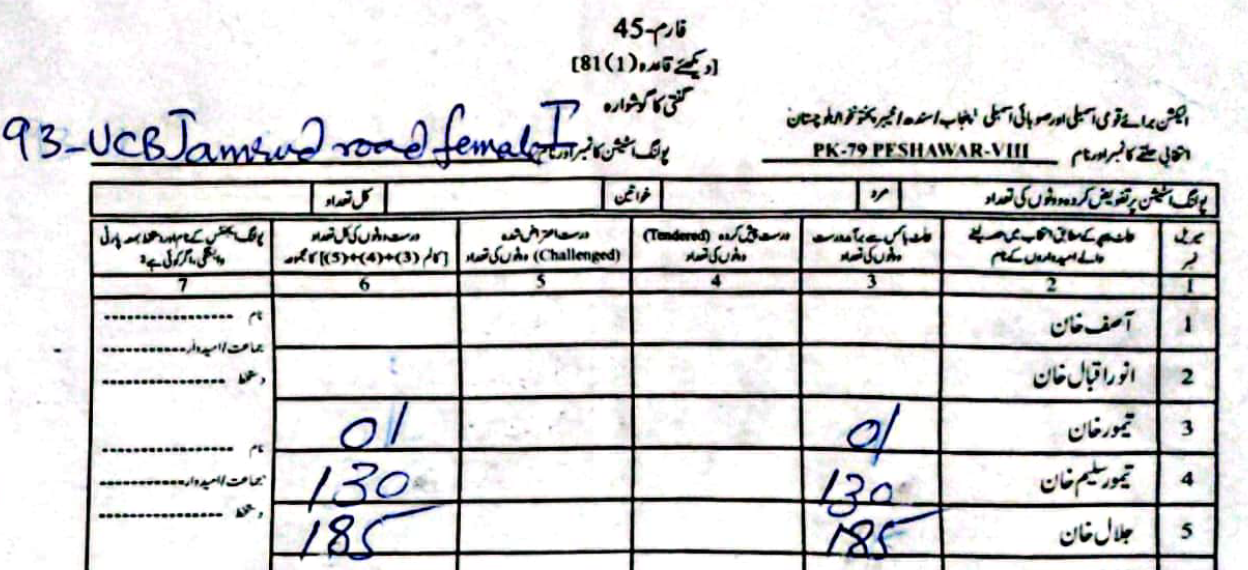
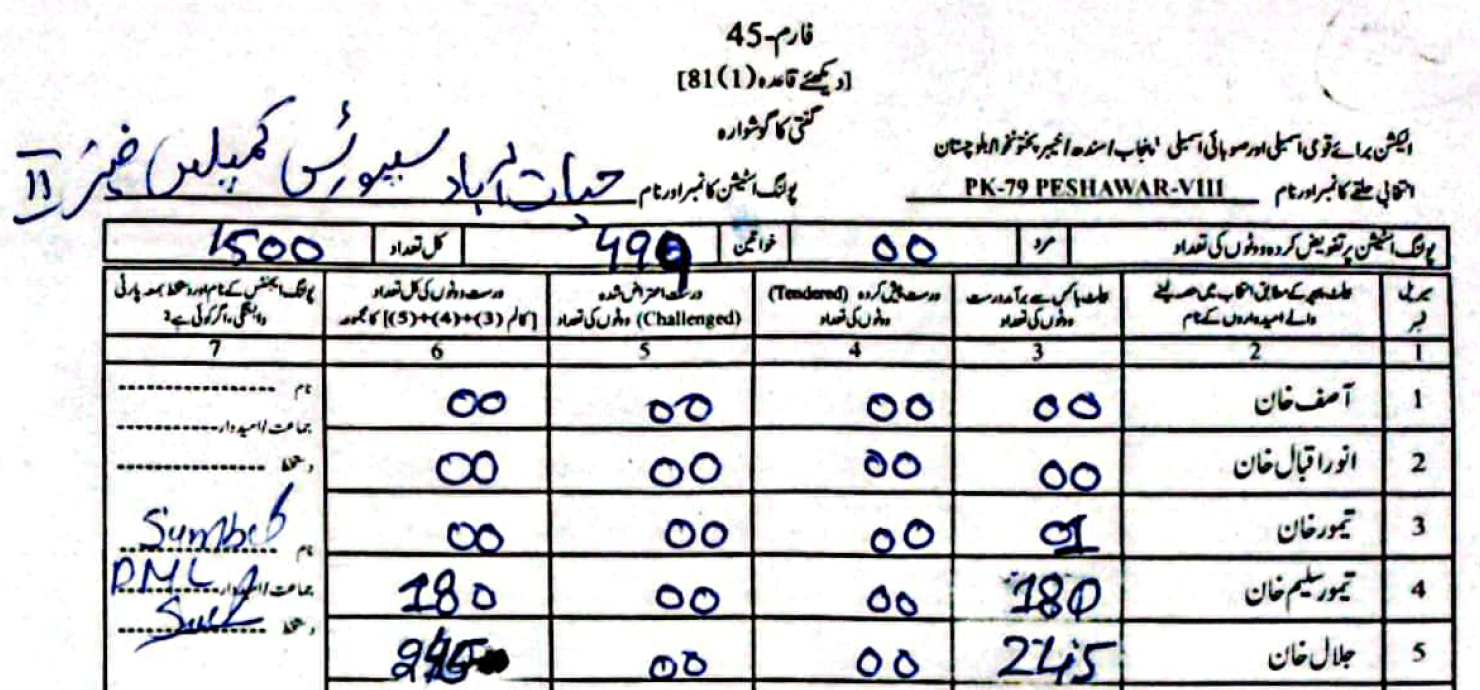
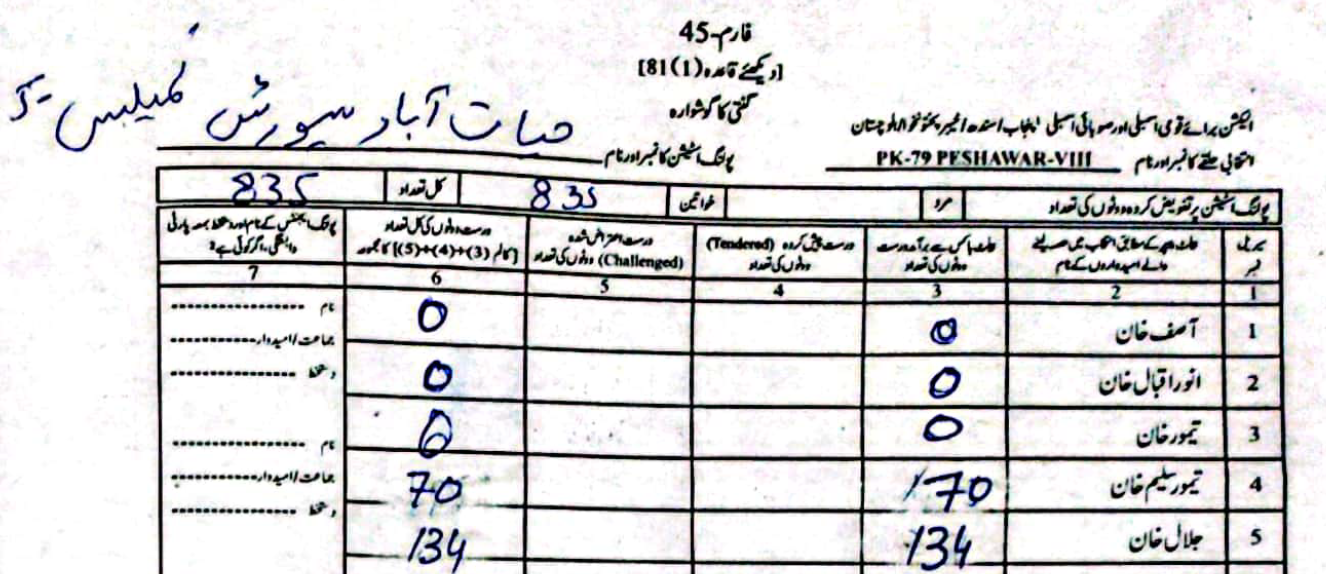
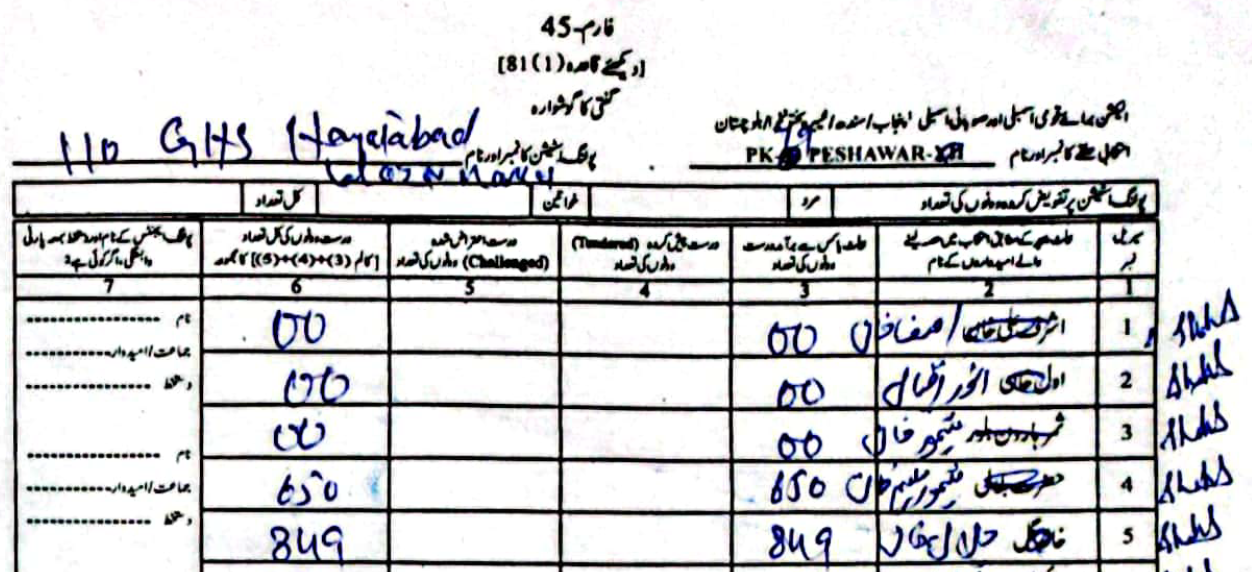
As an example, in PS-1 — 11-UPS-Jamrud Rd, according to the PTI form Jalal had \(46\) to Taimur's \(312\) votes. However, in the form the ECP uploaded, Taimur's voters were a much rounder \(120\), compared to Jalal's \(238\).
(Scroll horizontally to see more forms).
At this point, we can conclude with quite high confidence that there was vote flipping in PK-79. Votes that the voters gave to Taimur Jhagra were allocated to Jalal Khan’s tally post-elections. Our main statistical analysis is done at this point. We can now shift focus and do a comparative analysis of the ECP and the PTI forms to better understand how exactly the rigging happened.
Similarity between Distributions:We can start off by measuring the similarity of the election results between the results the ECP forms posted and the ones posted by PTI. If we were to measure the cosine similarity for each candidate between the unit-digits of the distributions for the PTI-forms and ECP-forms, we can get a sense of the extent of vote flipping. If the similarity is closer to \(1\) then that means that the two distributions are more or less the same (i.e. there were no changes between the forms) while a similarity closer to \(0\) would indicate that the vote distribution is drastically different.
| Candidate | Cosine Similarity |
|---|---|
The data shows that for Muhammad Siddique the cosine similarity is \(0.99\), which would indicate that there was almost no effort made to his votes. This is an expected outcome given that Siddique was being treated as a control group. However, for both Jalal Khan and Taimur Jhagra, the same can’t be said.
In other words, at this point we can conclude that there wasn’t whole-sale rigging against all the candidates. No one was going around rigging the election against or in favor of poor Siddique, but it does seem that they were going around and taking votes away from Taimur and giving them to Jalal.
What did the Electoral Manipulation look like:So far I have been claiming that PK-79 most probably experienced vote flipping and not some other form of vote-rigging. Going back to the example of PS-1, where the ECP form reported \(120\) votes for Taimur and \(238\) for Jalal, note that the total cumulative votes (\(358\)) is the same as the cumulative votes reported by the PTI forms (\(46\) for Jalal and \(312\) for Taimur). This would imply that someone had taken votes that were allocated to Taimur and given them to Jalal.
Cumulative Vote Sum: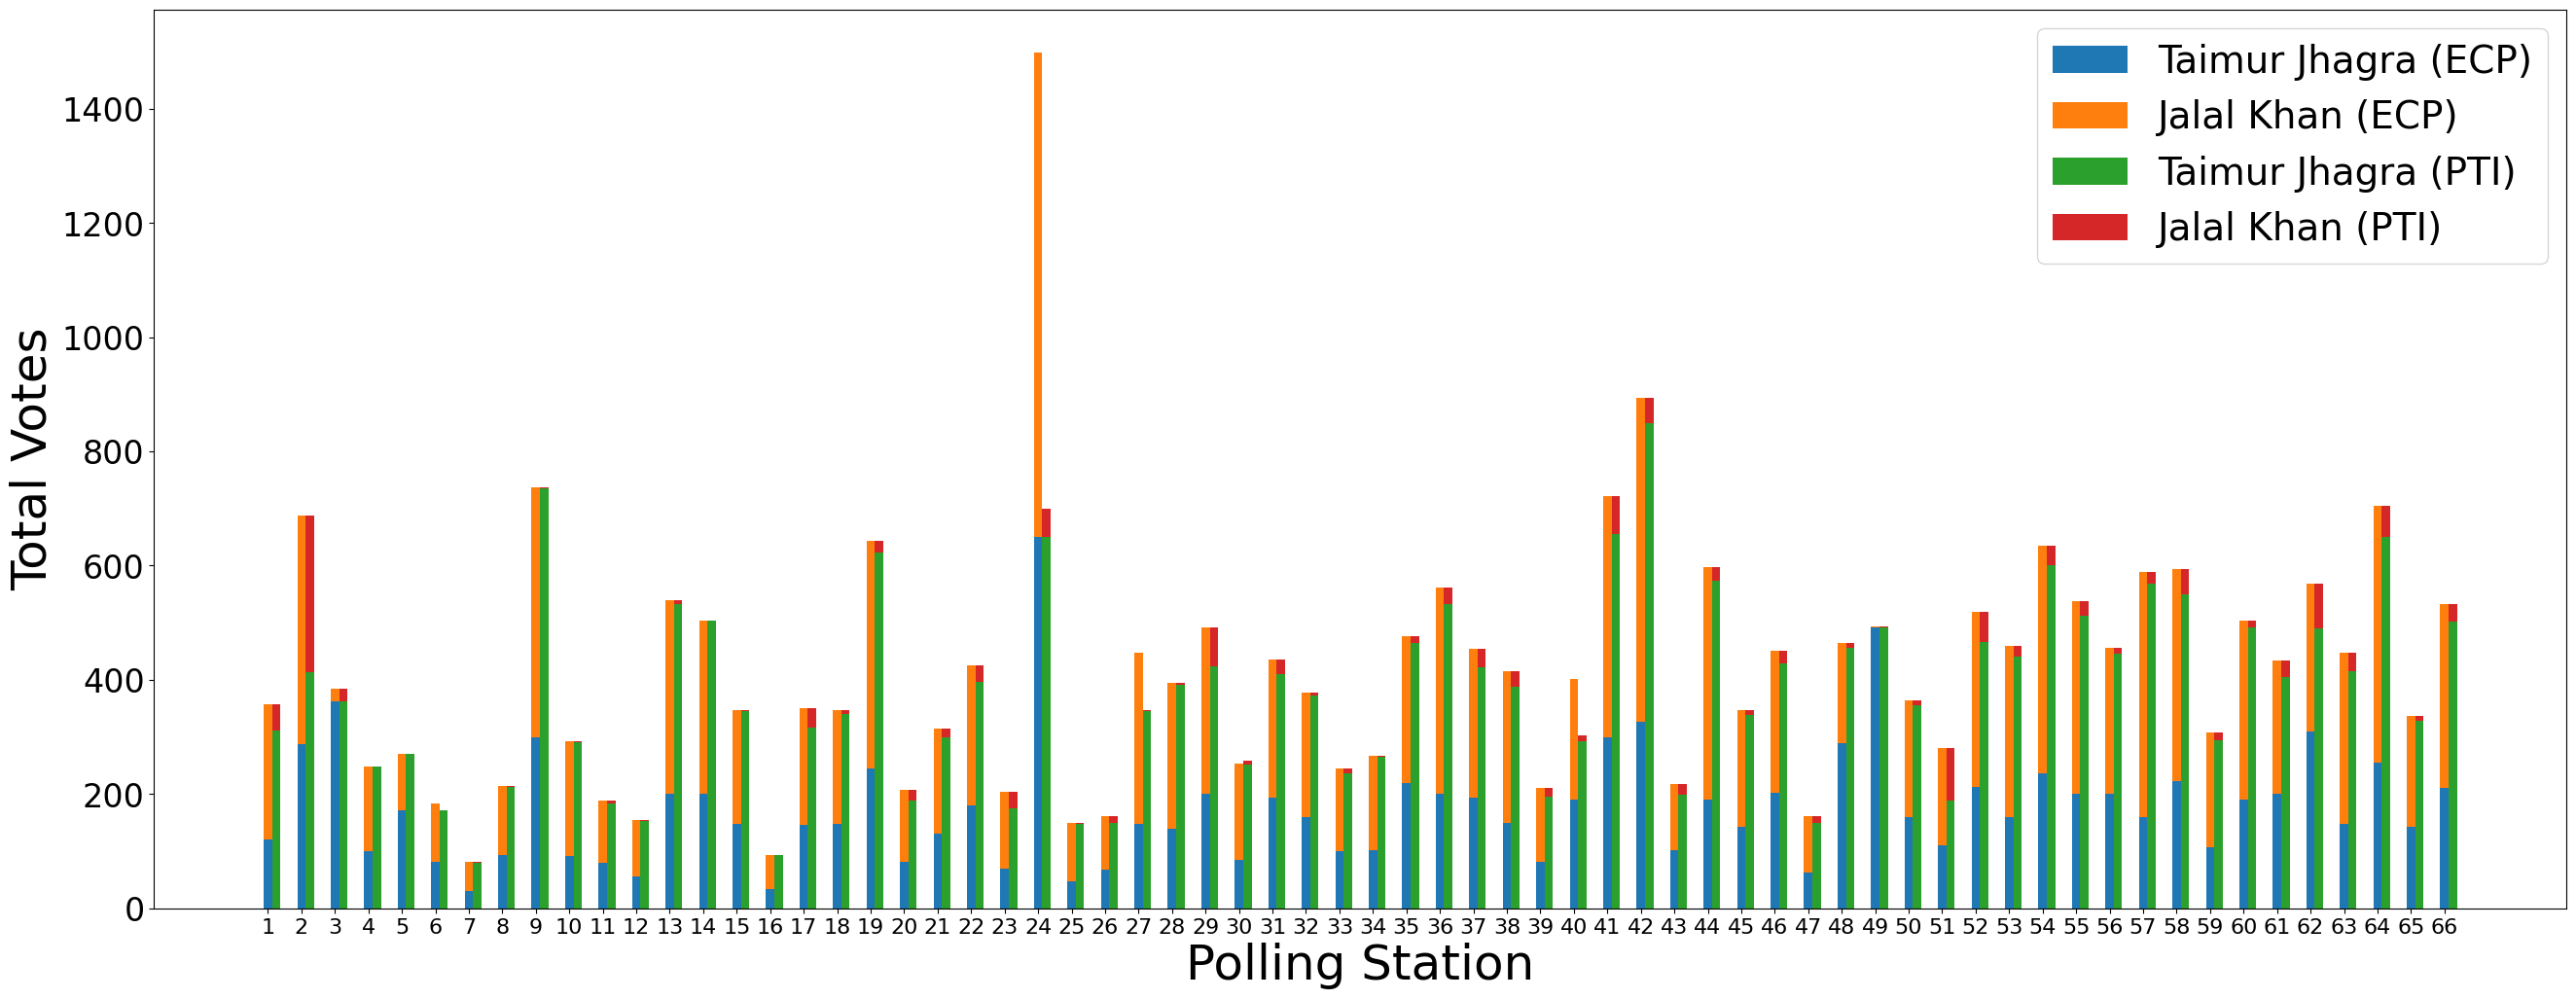
as listed on each form.
In \(61\) out of the \(66\) polling stations, the cumulative vote sum for the two candidates is the same. The only instances where this isn’t true is in the case of PS-6, PS-24, PS-27, PS-30, and PS-40. It seems someone didn’t get the memo. In all these cases the ECP-forms report more votes than the PTI-forms. We can therefore conclude that in these \(5\) polling stations there was potentially ballot stuffing rather than just vote rigging. Out of these, PS-24 was the most egregious, Jalal Khan had \(800\) voters magically come out of thin air to vote for him.
Votes Lost: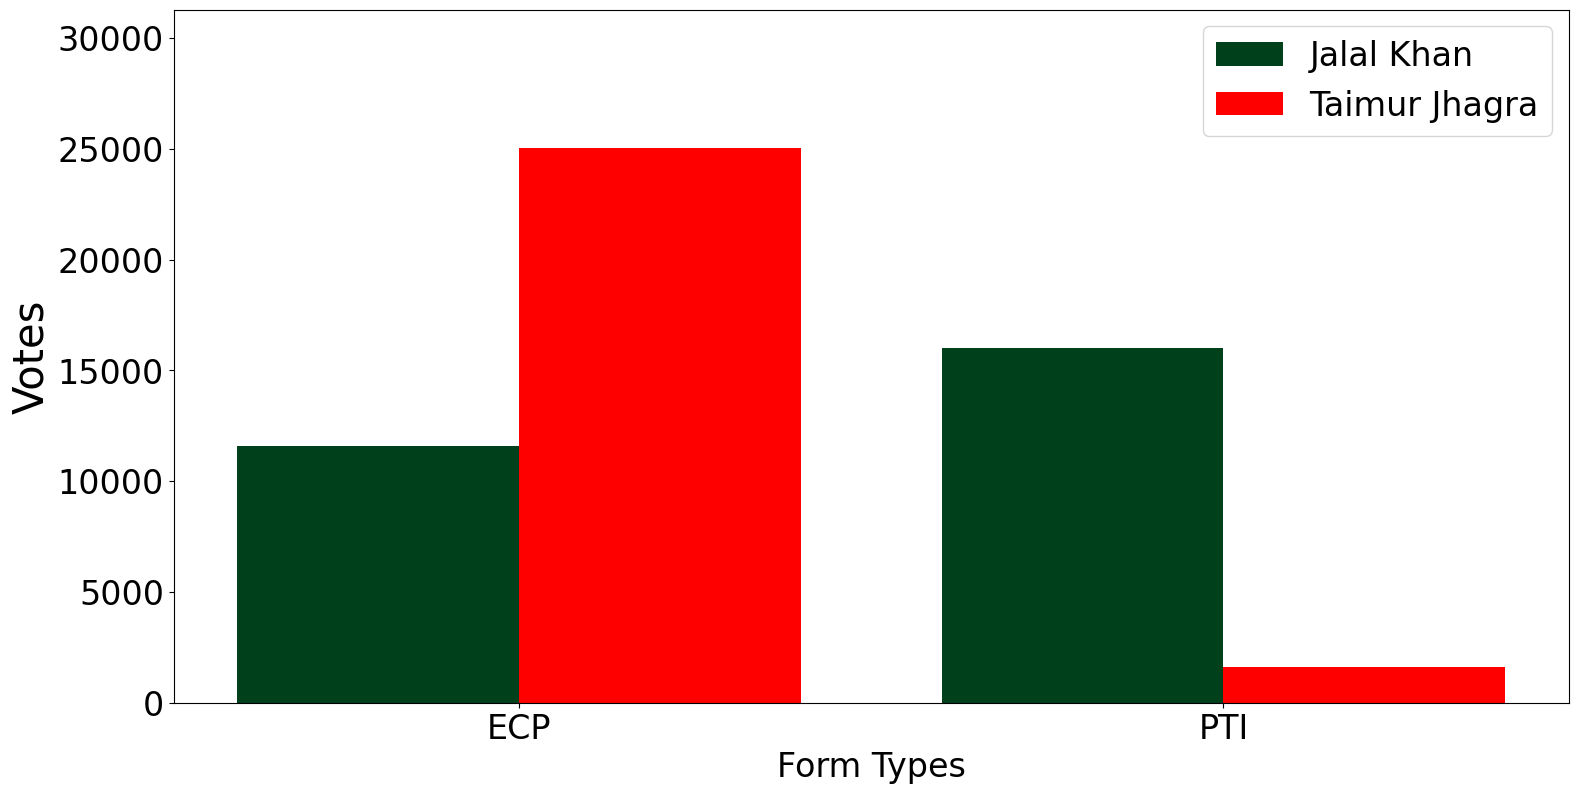
compared to the votes listed in the PTI forms.
Comparing the PTI-forms with the ECP-forms, we can conclude that in PK-79, Taimur lost at least \(13,416\) of his votes, while Jalal gained \(14,423\) more votes. Overall Jalal gained \(1,007\)[3] votes from voters, who didn’t even vote in the elections. This would once again indicate that there was some ballot stuffing, but in comparison to the vote flipping it was relatively minimal.
Vote Changes at the Polling StationWe now analyze the difference of the votes between the two form types:
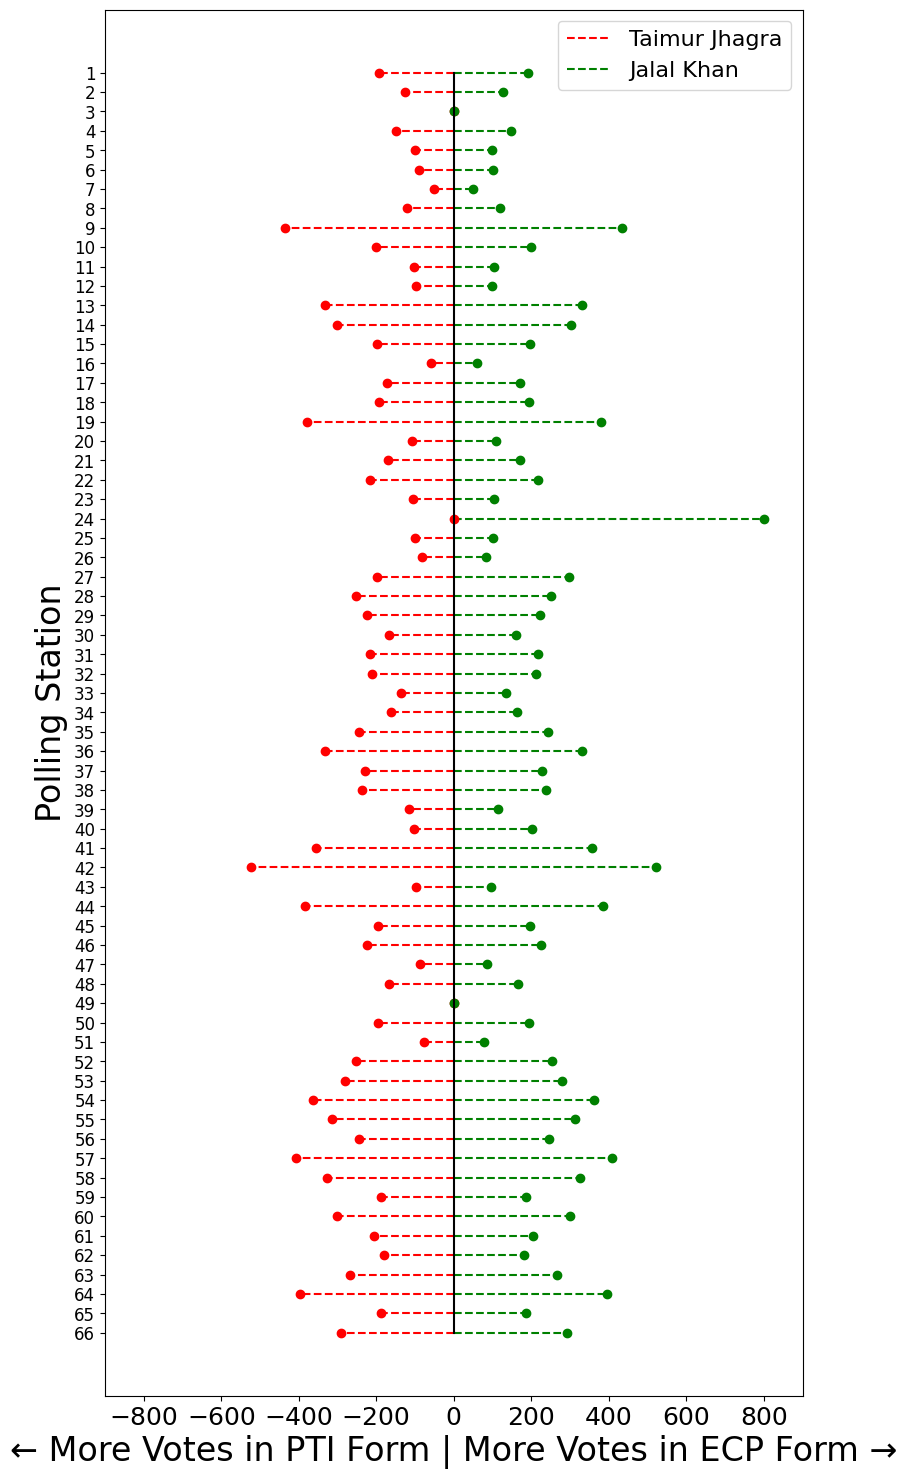
compared to the votes Jalal Khan gained.
Looking at this at the polling station level. It becomes quite apparent that at almost all the polling stations (except PS-3 and PS-49) Jalal had gained more votes than he was given by the voters, in other words, the ECP forms had allocated him more votes than the similar PTI forms. While Taimur has lost votes at all polling stations except PS-3, PS-24 and PS-49.
Conclusion:So far we have used one method to detect rigging. You might be right in thinking that just one method might signal rigging but does not prove it. However, if you actually bother to go through the ECP-forms yourself, you will reach the same conclusion.
I mean:
اتنی دھاندلی کہ اندھے کو بھی نظر آ جائے- [6]
[translation]But now you have mathematical evidence.
I have just done this analysis for one constituency PK-79. But if you are interested in the election results of any other consistency, you can replicate the same technique.The code for this project is up[4].
What Happens Next?If you are from PK-79 and are convinced of this analysis, you are probably wondering what is the point. Did your vote just go to waste?
Well, yes and no.
You might have voted thinking that your vote will help elect someone competent and bring about democratic change in the country and now feel like you have wasted your vote. I would just like to tell you that your vote has inadvertently managed to highlight the rot in the system, which is a different but equally valid outcome.
-
If you are the rot in the system and are also convinced of this analysis, then you’re probably wondering what is the point. If someone can detect your rigging with extremely basic maths, did all your efforts go to waste?
Fear not, Jalal Khan is still the representative of PK-79. And you have 5 years till the next election to come up with more effective rigging methods.